Technical Analysis of DFEN 2024-05-10
Overview:
In analyzing the technical indicators for DFEN over the last 5 days, we will delve into the trend, momentum, volatility, and volume indicators to provide a comprehensive outlook on the possible stock price movement in the coming days. By examining these key aspects, we aim to offer valuable insights and predictions for potential investors.
Trend Indicators:
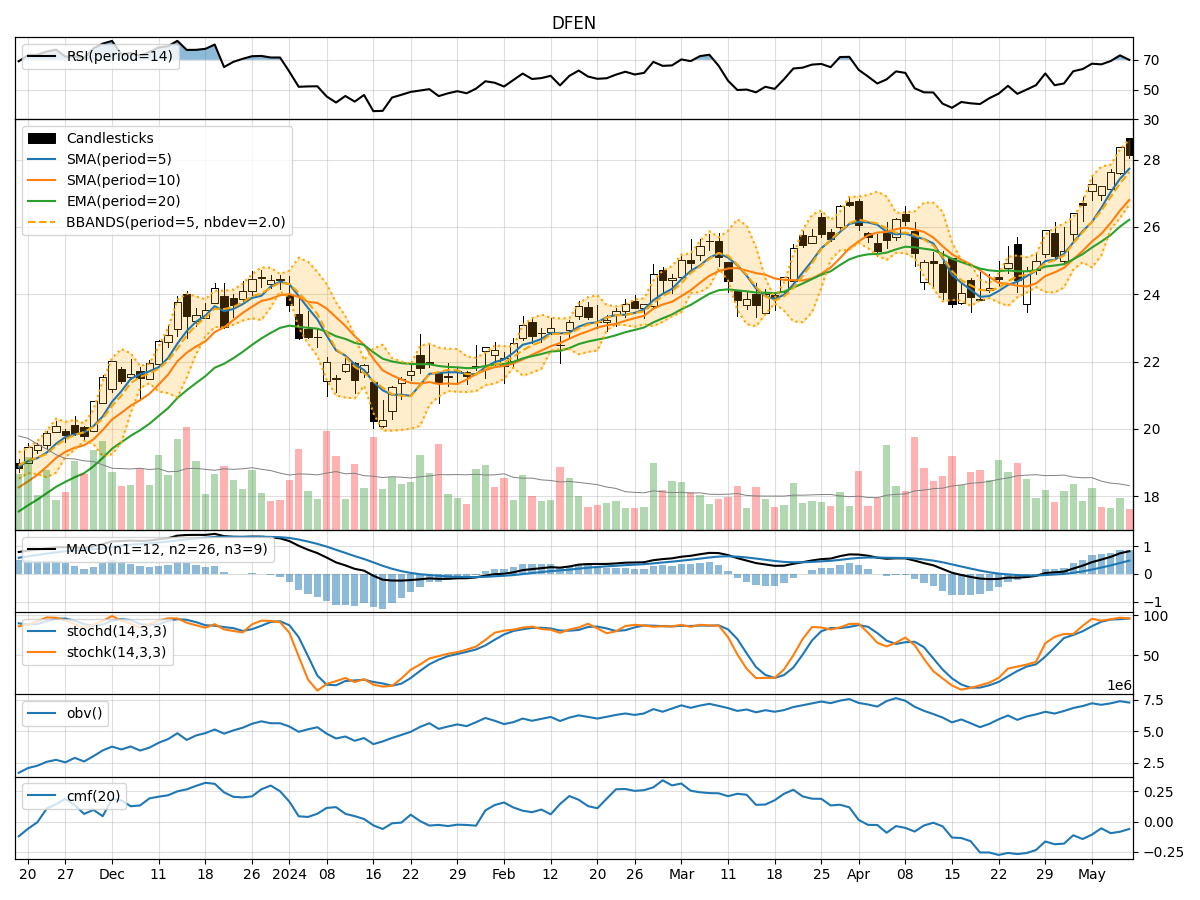
- Moving Averages (MA): The 5-day Moving Average has been consistently above the longer-term Simple Moving Average (SMA) and Exponential Moving Average (EMA), indicating a bullish trend.
- MACD: The MACD line has been above the signal line, with both showing an upward trend, suggesting bullish momentum.
- Conclusion: The trend indicators point towards an upward trend in the stock price.
Momentum Indicators:
- RSI: The Relative Strength Index (RSI) has been in the overbought territory, indicating strong buying momentum.
- Stochastic Oscillator: Both %K and %D have been in the overbought zone, suggesting a potential reversal.
- Conclusion: Momentum indicators signal a potential pullback due to overbought conditions.
Volatility Indicators:
- Bollinger Bands: The stock price has mostly stayed within the bands, with the %B indicator hovering around 0.7, indicating a moderate level of volatility.
- Conclusion: Volatility indicators suggest stable price movement within the bands.
Volume Indicators:
- On-Balance Volume (OBV): The OBV has shown mixed signals, fluctuating without a clear trend.
- Chaikin Money Flow (CMF): The CMF has been negative, indicating selling pressure.
- Conclusion: Volume indicators reflect uncertainty in market sentiment.
Conclusion:
Based on the analysis of the technical indicators, the stock price of DFEN is likely to experience a short-term pullback due to overbought conditions indicated by momentum indicators. However, the overall trend remains bullish as per the trend indicators. The volatility is expected to remain stable, while volume indicators suggest mixed sentiment among investors.
Recommendation:
Considering the bullish trend and stable volatility, investors may consider buying on dips during the anticipated pullback for potential long-term gains. However, it is crucial to monitor the momentum indicators for signs of a trend reversal and adjust the strategy accordingly. Additionally, keeping a close watch on volume indicators can provide insights into market sentiment shifts.
Disclaimer:
This analysis is based solely on technical indicators and does not take into account fundamental factors or external market influences. It is essential to conduct thorough research and consult with financial advisors before making any investment decisions.