Technical Analysis of DFGP 2024-05-10
Overview:
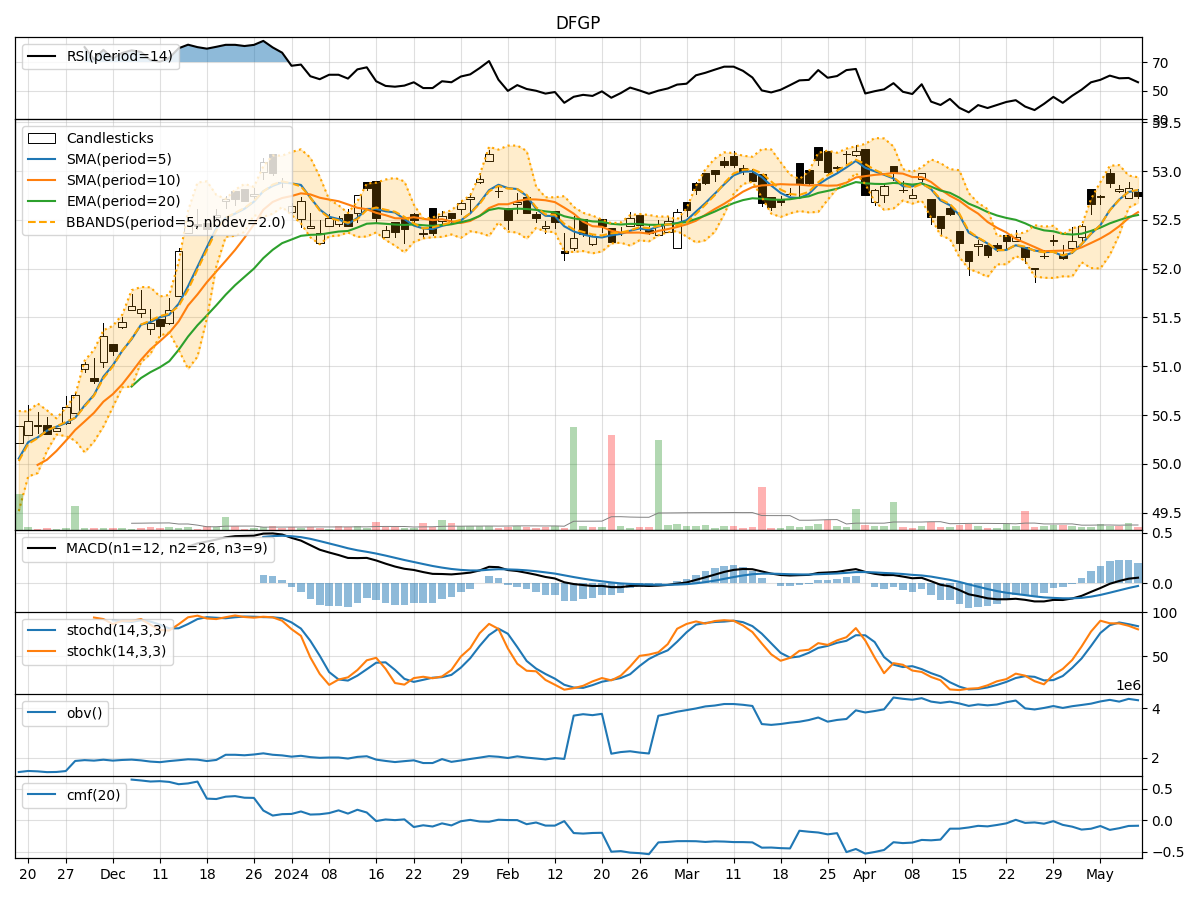
In analyzing the technical indicators for DFGP over the last 5 days, we will delve into the trend, momentum, volatility, and volume indicators to provide a comprehensive outlook on the possible stock price movement in the coming days. By examining key metrics such as moving averages, MACD, RSI, Bollinger Bands, and OBV, we aim to offer valuable insights and predictions for informed decision-making.
Trend Indicators:
- Moving Averages (MA): The 5-day MA has been consistently above the closing prices, indicating a short-term uptrend.
- MACD: The MACD line has been positive and trending upwards, suggesting bullish momentum.
- EMA: The EMA has been steadily increasing, supporting the bullish sentiment.
- Conclusion: The trend indicators point towards an upward movement in the stock price.
Momentum Indicators:
- RSI: The RSI has been fluctuating around the 50 level, indicating a neutral momentum.
- Stochastic Oscillator: Both %K and %D have been declining, signaling a potential reversal in momentum.
- Williams %R: The indicator has been in oversold territory, suggesting a possible bounce back.
- Conclusion: The momentum indicators suggest a sideways to slightly bullish momentum in the near term.
Volatility Indicators:
- Bollinger Bands: The stock price has been trading within the bands, indicating a period of consolidation.
- Bollinger %B: The %B has been hovering around the midline, reflecting a balanced volatility.
- Conclusion: Volatility indicators imply a consolidation phase with no clear directional bias.
Volume Indicators:
- On-Balance Volume (OBV): The OBV has been fluctuating but not showing a clear trend, suggesting indecision among market participants.
- Chaikin Money Flow (CMF): The CMF has been negative, indicating selling pressure.
- Conclusion: Volume indicators signal a lack of strong conviction from market participants.
Overall Conclusion:
Based on the analysis of trend, momentum, volatility, and volume indicators, the next few days' possible stock price movement for DFGP is likely to be sideways with a slight bullish bias. While the trend indicators support an upward movement, the momentum and volume indicators suggest a more neutral stance with a potential for a slight uptick. The volatility indicators point towards a period of consolidation, reinforcing the expectation of a sideways movement. Traders and investors should closely monitor key levels and wait for clearer signals before making significant trading decisions.
Key Recommendations:
- Monitor Key Levels: Keep a close eye on key support and resistance levels to gauge the stock's price action.
- Wait for Confirmation: Wait for confirmation from multiple indicators before taking significant trading positions.
- Consider Risk Management: Implement proper risk management strategies to protect against unexpected price movements.
- Stay Informed: Stay updated on market news and events that could impact the stock price.
In conclusion, while the technical indicators provide valuable insights, it is essential to consider other fundamental factors and market dynamics before making investment decisions. Conducting thorough research and seeking advice from financial advisors can further enhance decision-making processes.