Technical Analysis of DFGX 2024-05-10
Overview:
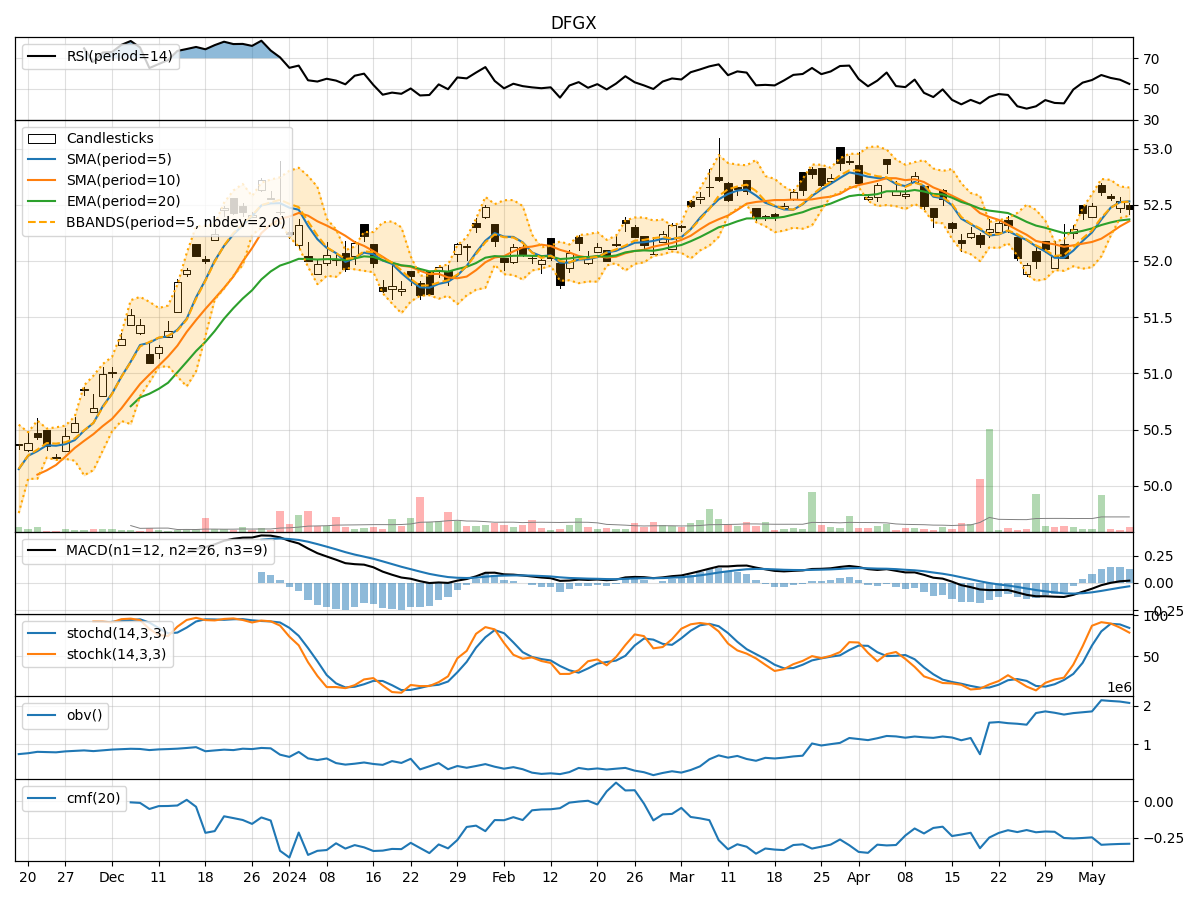
In analyzing the technical indicators for DFGX over the last 5 days, we will delve into the trend, momentum, volatility, and volume indicators to provide a comprehensive outlook on the possible stock price movement in the coming days. By examining these key aspects, we aim to offer valuable insights and predictions to guide your investment decisions.
Trend Analysis:
- Moving Averages (MA): The 5-day Moving Average (MA) has been consistently above the Simple Moving Average (SMA) and Exponential Moving Average (EMA), indicating a short-term uptrend.
- MACD: The MACD line has been positive and above the signal line, suggesting bullish momentum in the stock price.
- RSI: The Relative Strength Index (RSI) has been fluctuating around the 50 level, indicating a neutral stance in terms of momentum.
Momentum Analysis:
- Stochastic Oscillator: The Stochastic Oscillator has been gradually decreasing but remains in the overbought territory, signaling a potential reversal or consolidation.
- Williams %R: The Williams %R indicator has been moving lower into oversold levels, suggesting a possible bearish sentiment in the short term.
Volatility Analysis:
- Bollinger Bands: The Bollinger Bands have been narrowing, indicating decreasing volatility in the stock price.
- Average True Range (ATR): The ATR has been relatively stable, suggesting a lack of significant price fluctuations.
Volume Analysis:
- On-Balance Volume (OBV): The OBV indicator has been declining, indicating selling pressure in the stock.
- Chaikin Money Flow (CMF): The CMF has been negative, reflecting a bearish money flow trend.
Key Observations:
- The trend indicators suggest a short-term uptrend in the stock price.
- Momentum indicators show mixed signals with a potential reversal in the stochastic oscillator.
- Volatility remains low, indicating a lack of significant price movements.
- Volume indicators point towards selling pressure and bearish money flow.
Conclusion:
Based on the analysis of the technical indicators, the next few days' possible stock price movement for DFGX is likely to experience a consolidation phase with a slight downward bias. The mixed signals from momentum indicators, coupled with decreasing volatility and bearish volume trends, suggest a period of indecision and potential profit-taking by investors. It is advisable to closely monitor the price action and key support levels for any potential reversal or continuation of the current trend.