Technical Analysis of DFHY 2024-05-10
Overview:
In analyzing the technical indicators for DFHY over the last 5 days, we will delve into the trend, momentum, volatility, and volume indicators to provide a comprehensive outlook on the possible stock price movement in the coming days. By examining these key indicators, we aim to offer valuable insights and predictions for investors and traders.
Trend Indicators:
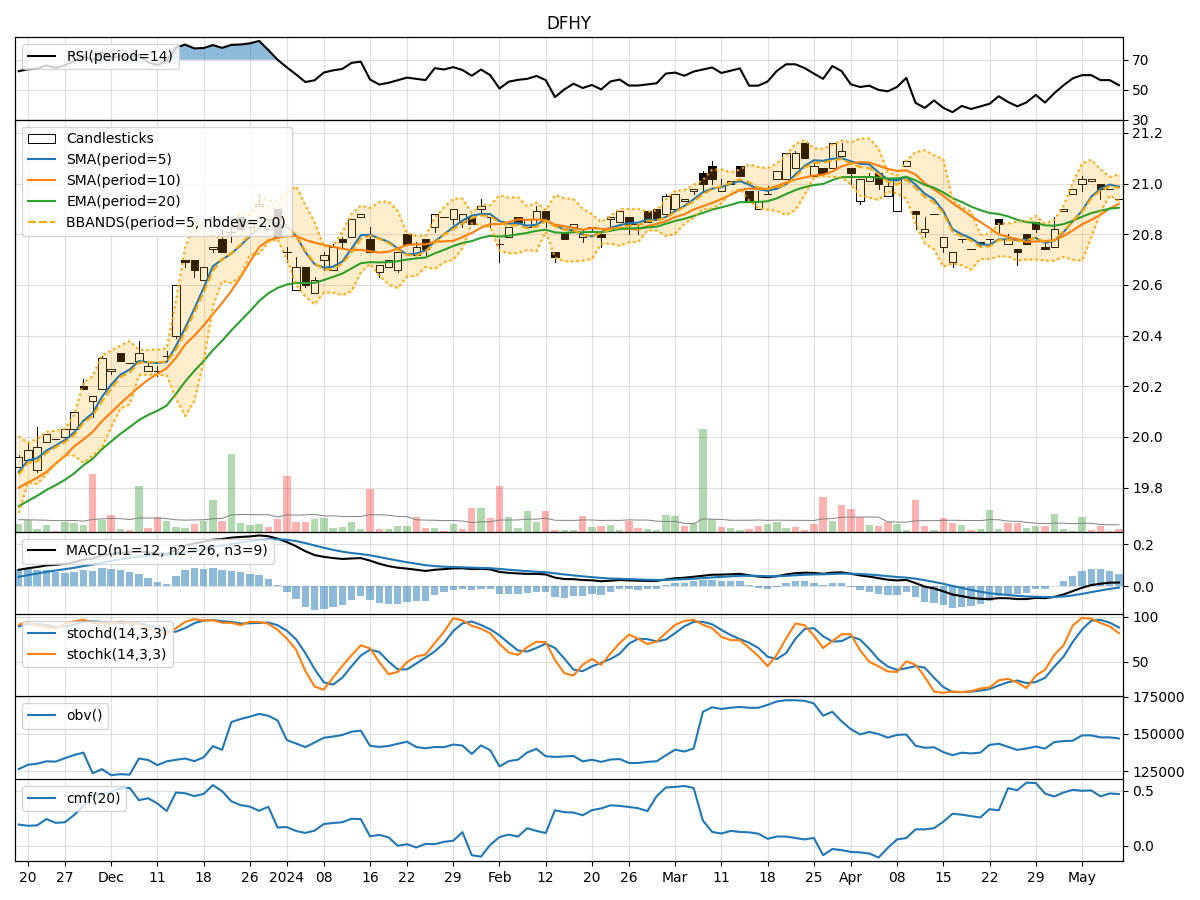
- Moving Averages (MA): The 5-day MA has been consistently above the 10-day SMA and 20-day EMA, indicating a short-term uptrend in the stock price.
- MACD: The MACD line has been consistently above the signal line, with both lines in positive territory, suggesting bullish momentum.
- RSI: The RSI has been fluctuating around the 50 level, indicating a neutral stance in terms of momentum.
Momentum Indicators:
- Stochastic Oscillator: The Stochastic K and D lines have been gradually decreasing, moving towards the oversold territory, signaling a potential reversal in momentum.
- Williams %R (WillR): The WillR indicator has been consistently in the oversold region, suggesting a possible buying opportunity.
Volatility Indicators:
- Bollinger Bands (BB): The stock price has been trading within the Bollinger Bands, with the bands narrowing, indicating decreasing volatility.
- BB %B: The %B indicator has been hovering around the midline, reflecting a balanced market sentiment.
Volume Indicators:
- On-Balance Volume (OBV): The OBV has been relatively stable, indicating a neutral volume flow in the stock.
- Chaikin Money Flow (CMF): The CMF has been fluctuating around the zero line, suggesting a balance between buying and selling pressure.
Key Observations and Opinions:
- Trend: The stock is currently in an upward trend based on the moving averages and MACD signals.
- Momentum: The momentum indicators are showing signs of weakness with the Stochastic oscillator approaching oversold levels.
- Volatility: Volatility is decreasing, as indicated by the narrowing Bollinger Bands.
- Volume: The volume indicators suggest a neutral stance with no significant buying or selling pressure.
Conclusion:
Based on the analysis of the technical indicators, the next few days for DFHY could see sideways consolidation with a slight bias towards a downward movement. Traders may consider waiting for a clearer signal before making significant trading decisions. It is essential to monitor the Stochastic oscillator for a potential reversal in momentum and the Bollinger Bands for any breakout signals.