Technical Analysis of DFIC 2024-05-10
Overview:
In analyzing the technical indicators for DFIC over the last 5 days, we will delve into the trend, momentum, volatility, and volume indicators to provide a comprehensive outlook on the possible stock price movement in the coming days. By examining these key aspects, we aim to offer valuable insights and predictions for potential investors.
Trend Analysis:
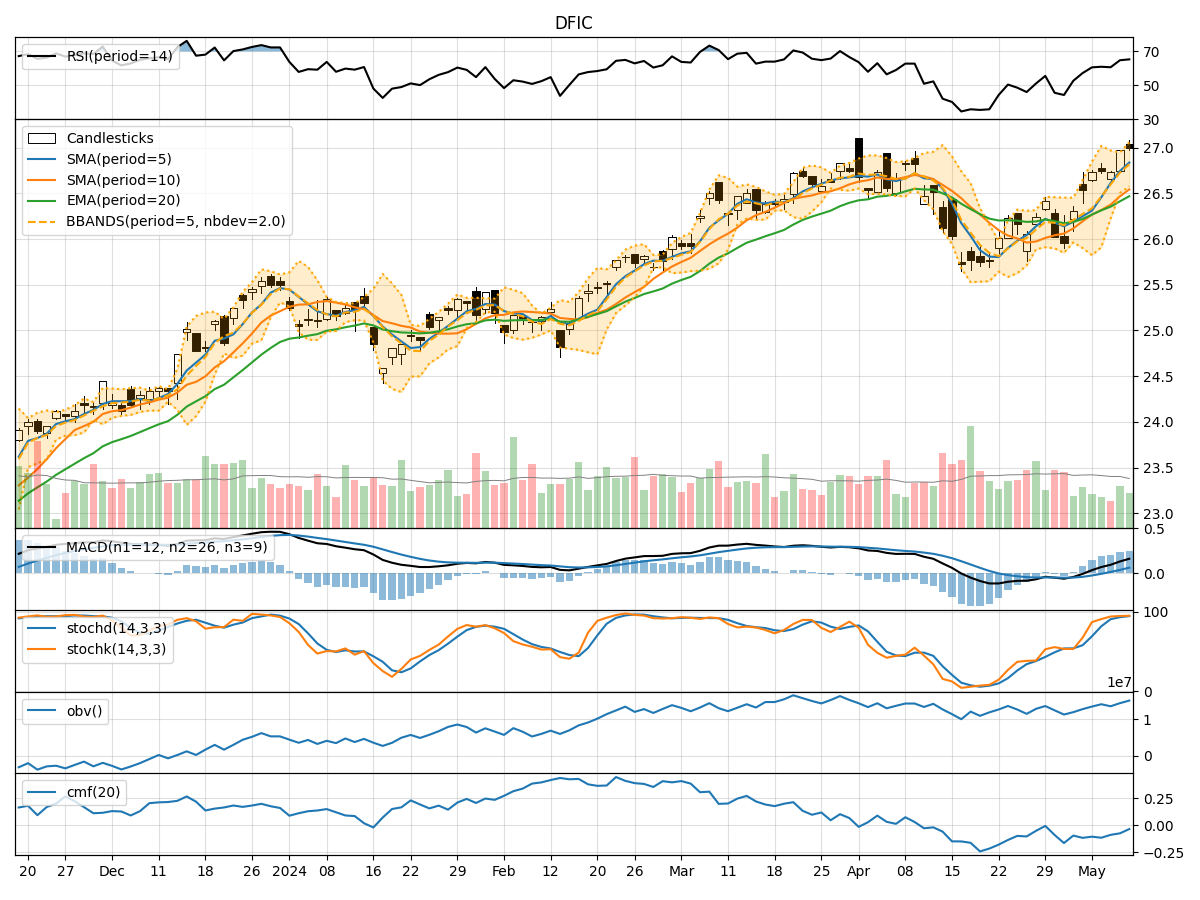
- Moving Averages (MA): The 5-day Moving Average (MA) has been consistently above the Simple Moving Average (SMA) and Exponential Moving Average (EMA), indicating an upward trend in the stock price.
- MACD: The MACD line has been consistently above the signal line, with both lines showing an upward trajectory, suggesting bullish momentum in the stock.
Momentum Analysis:
- RSI: The Relative Strength Index (RSI) has been hovering around 60-65, indicating neutral momentum in the stock.
- Stochastic Oscillator: Both %K and %D lines of the Stochastic Oscillator are in the overbought zone, suggesting a potential reversal in the stock price.
Volatility Analysis:
- Bollinger Bands (BB): The stock price has been trading within the Bollinger Bands, with the bands narrowing, indicating lower volatility in the stock.
- Bollinger %B: The %B indicator is around 0.8, suggesting that the stock is trading close to the upper band, potentially indicating an overbought condition.
Volume Analysis:
- On-Balance Volume (OBV): The OBV indicator has been showing a slight increase over the last 5 days, indicating some accumulation in the stock.
- Chaikin Money Flow (CMF): The CMF is negative, suggesting outflow of money from the stock over the analyzed period.
Conclusion:
Based on the technical indicators analyzed: - The stock is currently in an upward trend supported by moving averages and MACD. - Momentum indicators suggest neutral momentum with a potential for a reversal indicated by the Stochastic Oscillator. - Volatility is decreasing, indicating a potential consolidation phase in the stock price. - Volume indicators show mixed signals with slight accumulation but overall outflow of money.
Forecast:
Considering the overall analysis, the next few days may see the stock price experiencing consolidation or a slight pullback due to the neutral momentum and potential overbought condition indicated by the Stochastic Oscillator. Investors should closely monitor the price action for any signs of a reversal or continuation of the current trend.