Technical Analysis of DFIP 2024-05-10
Overview:
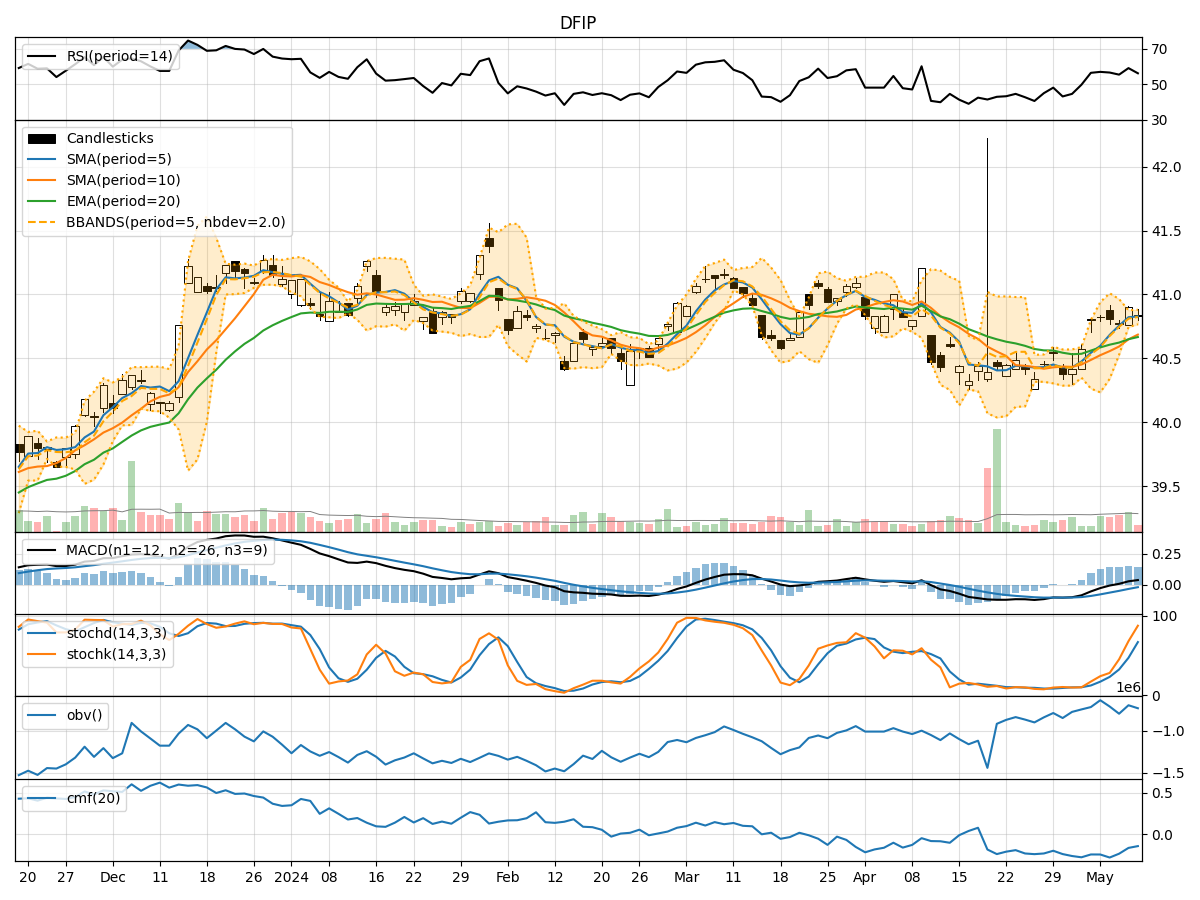
In the last 5 trading days, DFIP stock has shown mixed signals across various technical indicators. The trend indicators suggest a slightly bullish sentiment, with the moving averages trending upwards. Momentum indicators show a mixed picture, with RSI indicating a neutral stance. Volatility indicators suggest a narrowing of the Bollinger Bands, indicating potential consolidation. Volume indicators show a slight decrease in On-Balance Volume (OBV) and Chaikin Money Flow (CMF), indicating some selling pressure.
Trend Indicators:
- Moving Averages (MA): The 5-day MA is trending above the 10-day SMA, indicating a short-term bullish trend.
- MACD: The MACD line is above the signal line, indicating a bullish momentum.
- MACD Histogram: The histogram is positive, suggesting increasing bullish momentum.
Momentum Indicators:
- RSI: The RSI is around 56, indicating a neutral stance without being overbought or oversold.
- Stochastic Oscillator: Both %K and %D are in the overbought territory, suggesting a potential reversal.
- Williams %R: The indicator is close to the oversold region, indicating a possible buying opportunity.
Volatility Indicators:
- Bollinger Bands (BB): The bands are narrowing, suggesting a period of consolidation or reduced volatility.
- Bollinger %B: The %B is below 1, indicating the price is below the upper band but not in oversold territory.
Volume Indicators:
- On-Balance Volume (OBV): The OBV has shown a slight decrease, indicating some distribution of shares.
- Chaikin Money Flow (CMF): The CMF is negative, suggesting selling pressure in the stock.
Key Observations:
- The trend indicators show a bullish bias, supported by the moving averages and MACD.
- Momentum indicators present a mixed picture, with the RSI neutral but Stochastic Oscillator indicating potential overbought conditions.
- Volatility indicators suggest a period of consolidation, with the Bollinger Bands narrowing.
- Volume indicators show a slight decrease in buying pressure, as indicated by OBV and CMF.
Conclusion:
Based on the analysis of the technical indicators, the next few days' possible stock price movement for DFIP is likely to be sideways with a slight bullish bias. The narrowing Bollinger Bands and mixed momentum indicators suggest a period of consolidation with potential for a slight upward movement. However, caution is advised due to the overbought signals from the Stochastic Oscillator and the negative CMF. Traders may consider waiting for clearer signals or implementing tight risk management strategies in their trading decisions.