Technical Analysis of DFIS 2024-05-10
Overview:
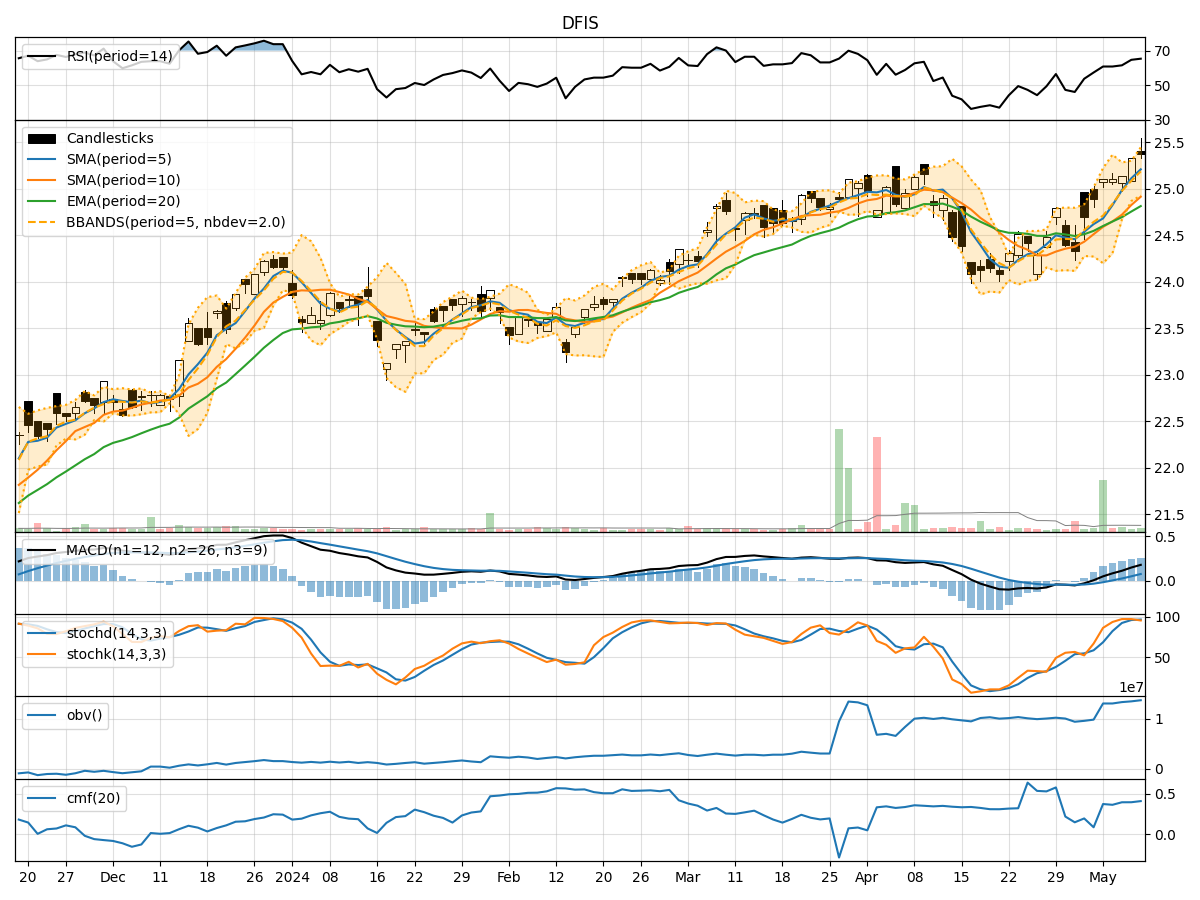
In analyzing the technical indicators for DFIS over the last 5 days, we will delve into the trend, momentum, volatility, and volume indicators to provide a comprehensive outlook on the possible stock price movement in the coming days. By examining these key aspects, we aim to offer valuable insights and predictions for potential investors and traders.
Trend Indicators:
- Moving Averages (MA): The 5-day MA has been consistently above the closing prices, indicating a bullish trend.
- MACD: The MACD line has been steadily increasing, with the MACD histogram showing positive values, suggesting a strengthening bullish momentum.
- EMA: The EMA has been trending upwards, supporting the bullish sentiment in the short term.
Momentum Indicators:
- RSI: The RSI has been in the overbought territory, indicating a strong bullish momentum.
- Stochastic Oscillator: Both %K and %D have been in the overbought zone, signaling a potential reversal or consolidation.
- Williams %R: The indicator has been in the oversold region, suggesting a possible reversal in the short term.
Volatility Indicators:
- Bollinger Bands: The price has been trading within the bands, indicating normal volatility.
- Bollinger %B: The %B indicator has been fluctuating around the midline, suggesting a balanced market sentiment.
Volume Indicators:
- On-Balance Volume (OBV): The OBV has been steadily increasing, reflecting strong buying pressure.
- Chaikin Money Flow (CMF): The CMF has been positive, indicating a healthy inflow of money into the stock.
Key Observations and Opinions:
- Trend: The trend indicators suggest a strong bullish sentiment in the short term.
- Momentum: While momentum indicators show overbought conditions, the bullish momentum is still prevalent.
- Volatility: Volatility remains relatively stable, with no significant spikes or drops.
- Volume: Increasing OBV and positive CMF indicate growing buying interest in the stock.
Conclusion:
Based on the analysis of the technical indicators, the stock is likely to continue its upward trajectory in the next few days. The bullish trend, supported by positive momentum and volume inflow, indicates a favorable outlook for potential price appreciation. Traders and investors may consider buying opportunities in anticipation of further price gains. However, it is essential to monitor the overbought conditions in the momentum indicators for potential signs of a reversal or consolidation.