Technical Analysis of DFLV 2024-05-10
Overview:
In analyzing the technical indicators for DFLV over the last 5 days, we will delve into the trend, momentum, volatility, and volume indicators to provide a comprehensive outlook on the possible stock price movement in the coming days. By examining these key aspects, we aim to offer valuable insights and predictions for informed decision-making.
Trend Indicators:
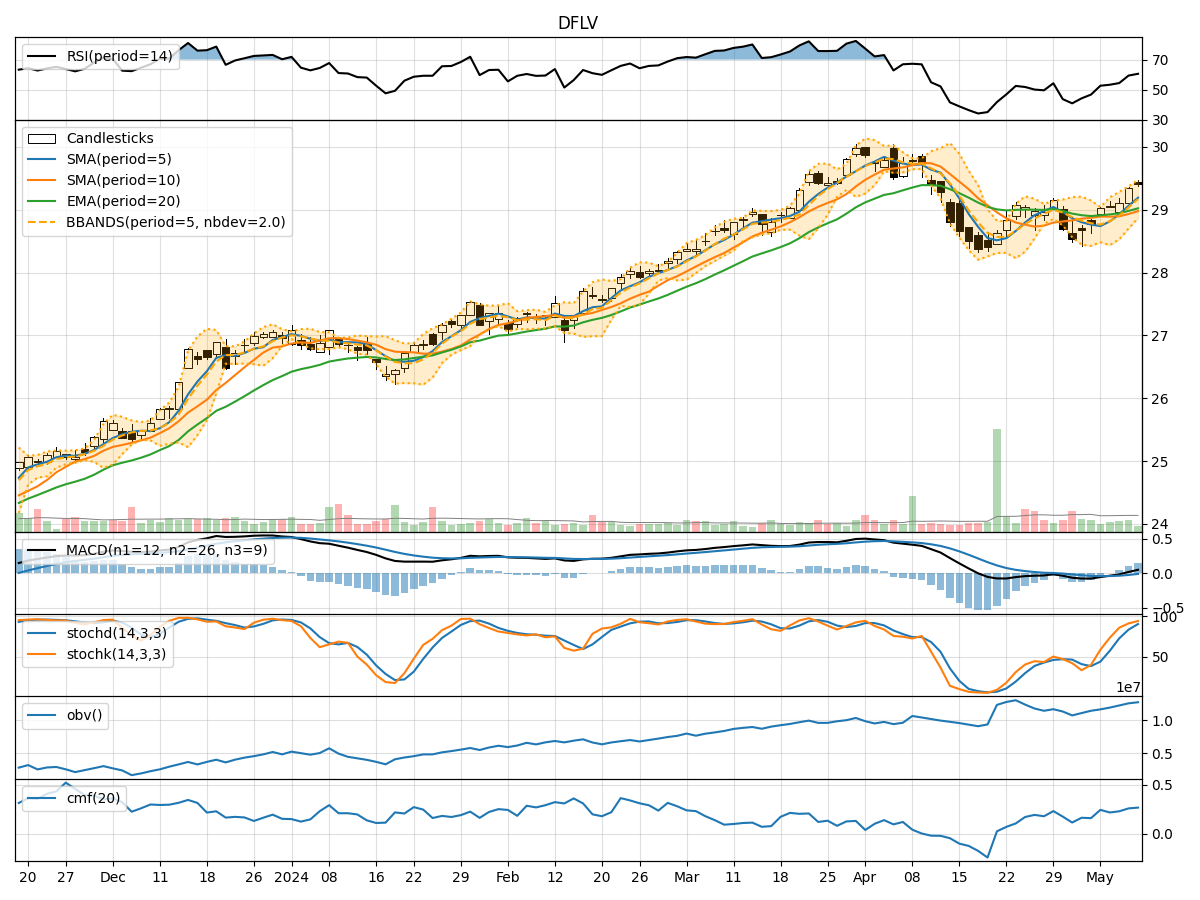
- Moving Averages (MA): The 5-day MA has been consistently above the closing prices, indicating a bullish trend.
- MACD: The MACD line has been trending upwards, with the MACD histogram showing positive values, suggesting bullish momentum.
- EMA: The EMA has been steadily increasing, supporting the bullish trend.
Momentum Indicators:
- RSI: The RSI has been trending upwards, indicating increasing buying pressure.
- Stochastic Oscillator: Both %K and %D have been in the overbought zone, suggesting a strong bullish momentum.
- Williams %R: The indicator has been fluctuating but generally staying in the oversold territory, signaling potential buying opportunities.
Volatility Indicators:
- Bollinger Bands: The stock price has been trading within the bands, with the upper band acting as resistance and the lower band as support.
- Bollinger %B: The %B indicator has been fluctuating around 0.8, indicating a relatively high price compared to the bands.
Volume Indicators:
- On-Balance Volume (OBV): The OBV has been steadily increasing, reflecting accumulation by investors.
- Chaikin Money Flow (CMF): The CMF has been positive, indicating buying pressure in the market.
Key Observations:
- The trend indicators suggest a strong bullish sentiment, supported by the moving averages and MACD.
- Momentum indicators point towards a continuation of the bullish trend, with RSI and Stochastic Oscillator in overbought territory.
- Volatility indicators show a relatively stable price movement within the Bollinger Bands.
- Volume indicators indicate increasing buying pressure and positive money flow into the stock.
Conclusion:
Based on the analysis of the technical indicators, the next few days' possible stock price movement for DFLV is likely to be upward. The bullish trend supported by moving averages, MACD, RSI, and Stochastic Oscillator signals a continuation of the positive momentum. The stable price movement within the Bollinger Bands and increasing volume further support the upward trajectory. Traders and investors may consider buying opportunities in DFLV based on the current technical outlook.
Disclaimer:
This analysis is based solely on technical indicators and historical data, and actual market movements may vary. It is essential to consider other fundamental factors and risk management strategies before making any investment decisions.