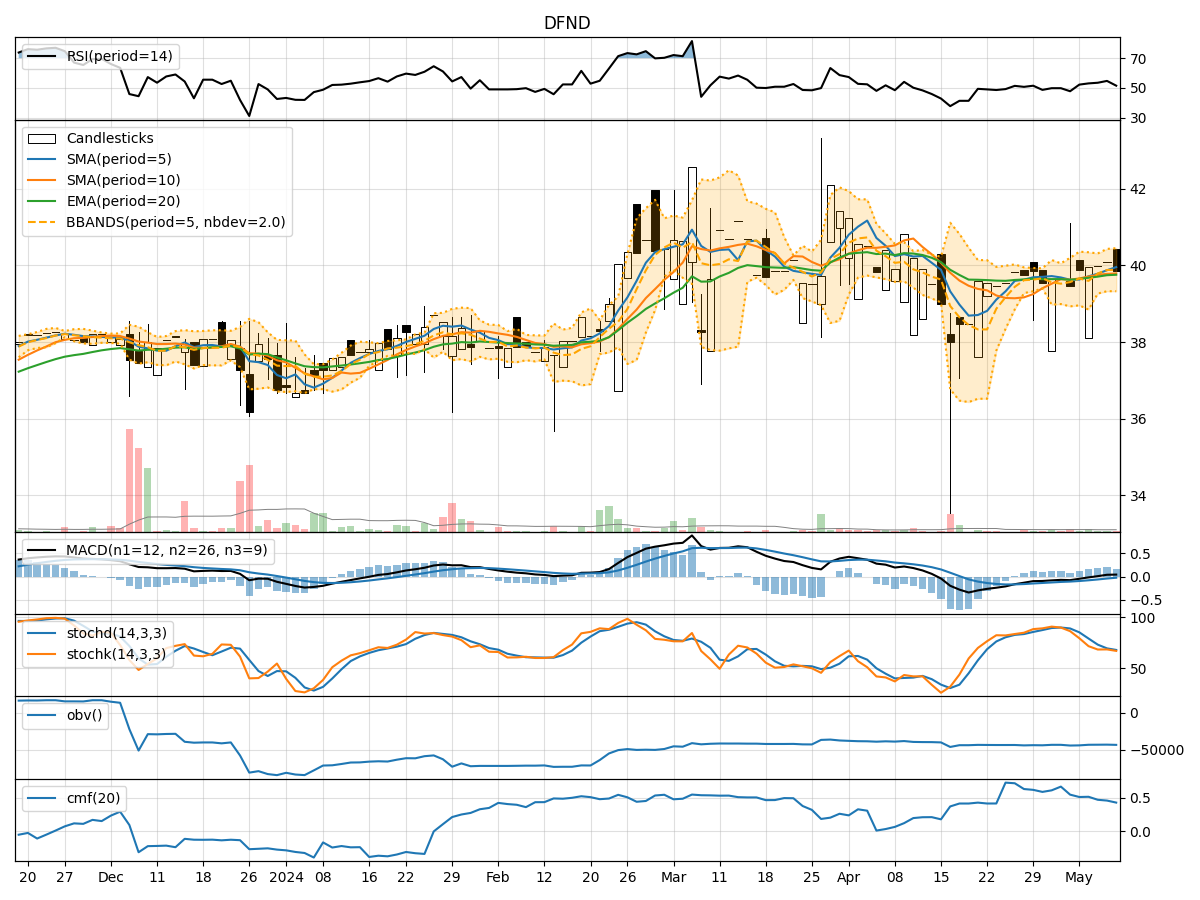
Technical Analysis of DFND 2024-05-10
Overview:
In the last 5 trading days, DFND stock has shown a mixed performance based on various technical indicators. The trend indicators suggest a slight uptrend, with moving averages and MACD showing positive signals. Momentum indicators indicate a neutral to slightly bullish sentiment, while volatility indicators show a narrowing Bollinger Bands, indicating potential consolidation. Volume indicators also suggest a neutral sentiment with no significant divergence.
Trend Indicators:
- Moving Averages (MA): The 5-day MA is above both the 10-day SMA and 20-day EMA, indicating a short-term uptrend.
- MACD: The MACD line is above the signal line, with both lines in positive territory, suggesting bullish momentum.
Key Observation: The trend indicators point towards a bullish sentiment in the short term.
Momentum Indicators:
- RSI: The RSI is in the neutral zone around 50, indicating neither overbought nor oversold conditions.
- Stochastic Oscillator: Both %K and %D are in the neutral zone, suggesting a lack of strong momentum.
Key Observation: Momentum indicators reflect a neutral to slightly bullish sentiment.
Volatility Indicators:
- Bollinger Bands (BB): The bands are narrowing, indicating decreasing volatility and a potential period of consolidation.
Key Observation: Volatility indicators suggest a consolidation phase in the near term.
Volume Indicators:
- On-Balance Volume (OBV): The OBV shows a slight increase, indicating some accumulation.
- Chaikin Money Flow (CMF): The CMF is positive but decreasing, suggesting a weakening buying pressure.
Key Observation: Volume indicators signal a neutral sentiment with a slight bias towards accumulation.
Conclusion:
Based on the analysis of the technical indicators, the next few days for DFND stock are likely to see a sideways movement with a slight bullish bias. The trend indicators support a bullish sentiment, while momentum indicators are neutral to slightly bullish. Volatility indicators point towards a consolidation phase, and volume indicators suggest a neutral stance with a slight accumulation.
Overall, the stock is expected to trade within a range with a potential upside bias. Traders may consider monitoring key support and resistance levels for potential entry and exit points.