Technical Analysis of DFNM 2024-05-10
Overview:
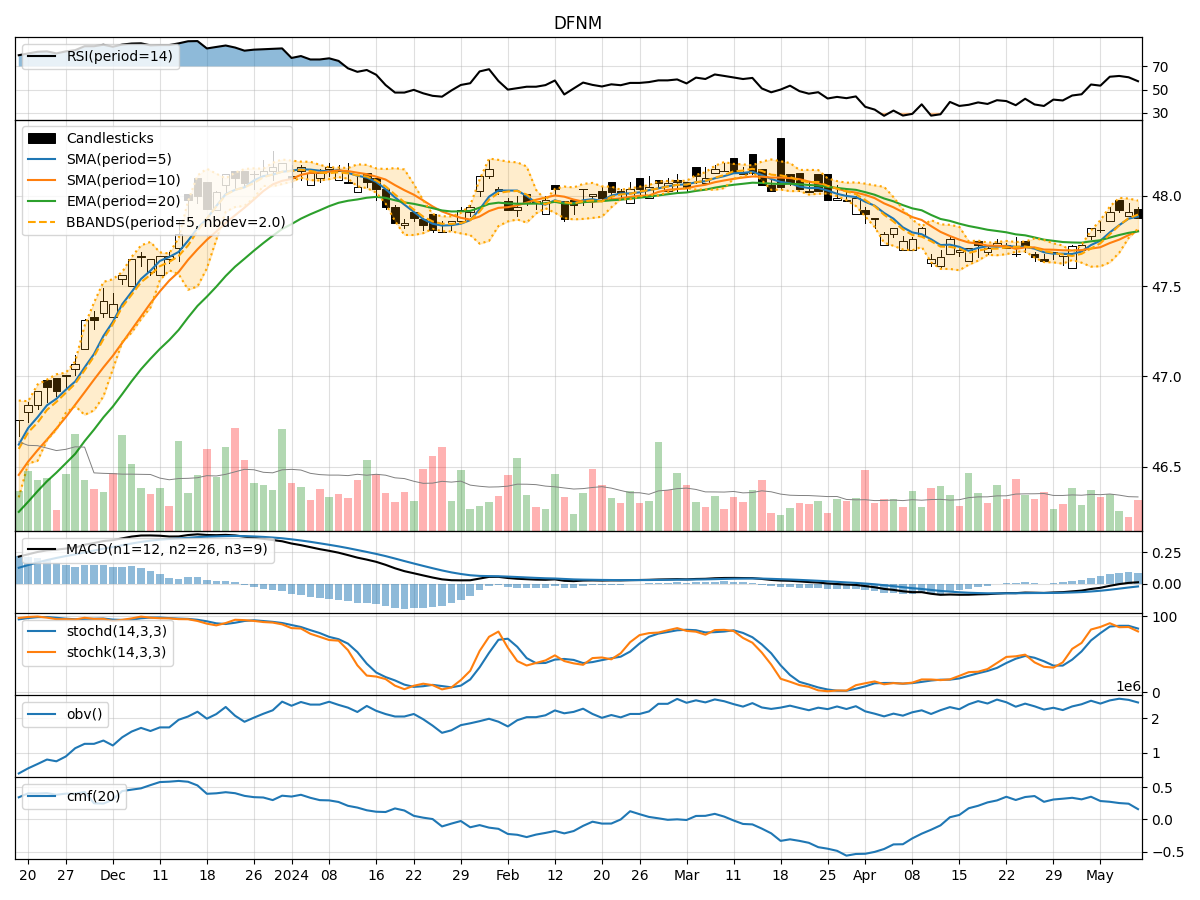
In analyzing the technical indicators for DFNM stock over the last 5 days, we will delve into the trend, momentum, volatility, and volume indicators to provide a comprehensive outlook on the possible future stock price movement. By examining these key aspects, we aim to offer valuable insights and predictions for the upcoming trading days.
Trend Analysis:
- Moving Averages (MA): The 5-day Moving Average (MA) has been gradually increasing, indicating a positive trend in the stock price.
- MACD: The MACD line has been consistently above the signal line, suggesting bullish momentum in the stock.
- EMA: The Exponential Moving Average (EMA) has been trending upwards, supporting the bullish sentiment in the stock.
Key Observation: The trend indicators point towards a bullish outlook for DFNM stock.
Momentum Analysis:
- RSI: The Relative Strength Index (RSI) has been fluctuating but remains in the neutral zone, indicating balanced momentum.
- Stochastic Oscillator: Both %K and %D have been relatively high, suggesting potential overbought conditions.
- Williams %R: The Williams %R is in the oversold territory, indicating a possible reversal in momentum.
Key Observation: The momentum indicators signal a mixed sentiment with a slight bearish bias due to potential overbought conditions.
Volatility Analysis:
- Bollinger Bands: The stock price has been trading within the Bollinger Bands, with the bands narrowing, indicating decreasing volatility.
- Bollinger %B: The %B indicator shows the stock price is currently trading close to the upper band, suggesting a potential overbought scenario.
Key Observation: Volatility indicators suggest a decreasing volatility environment with a potential overbought signal.
Volume Analysis:
- On-Balance Volume (OBV): The OBV has been fluctuating but has not shown a clear trend, indicating mixed buying and selling pressure.
- Chaikin Money Flow (CMF): The CMF has been declining, suggesting a decrease in buying pressure over the past 20 days.
Key Observation: Volume indicators reflect mixed sentiment with a slight bearish bias due to decreasing buying pressure.
Conclusion:
Based on the analysis of trend, momentum, volatility, and volume indicators, the overall outlook for DFNM stock in the next few days is cautiously bullish with a potential for a short-term pullback due to overbought conditions indicated by momentum and volatility indicators. Traders should closely monitor the stock price for signs of a reversal in momentum and consider taking profits if the stock becomes overextended.
Key Takeaways:
- Trend: Upward trend, indicating bullish sentiment.
- Momentum: Mixed sentiment with a slight bearish bias.
- Volatility: Decreasing volatility with a potential overbought signal.
- Volume: Mixed sentiment with a slight bearish bias.
Recommendation:
Consider taking profits on any significant price increases and monitor closely for a potential reversal in momentum. Exercise caution and implement risk management strategies to navigate the market uncertainties effectively.