Technical Analysis of DFNV 2024-05-10
Overview:
In analyzing the technical indicators for DFNV over the last 5 days, we will delve into the trend, momentum, volatility, and volume indicators to provide a comprehensive outlook on the possible stock price movement in the coming days. By examining these key indicators, we aim to offer valuable insights and predictions for investors and traders.
Trend Indicators:
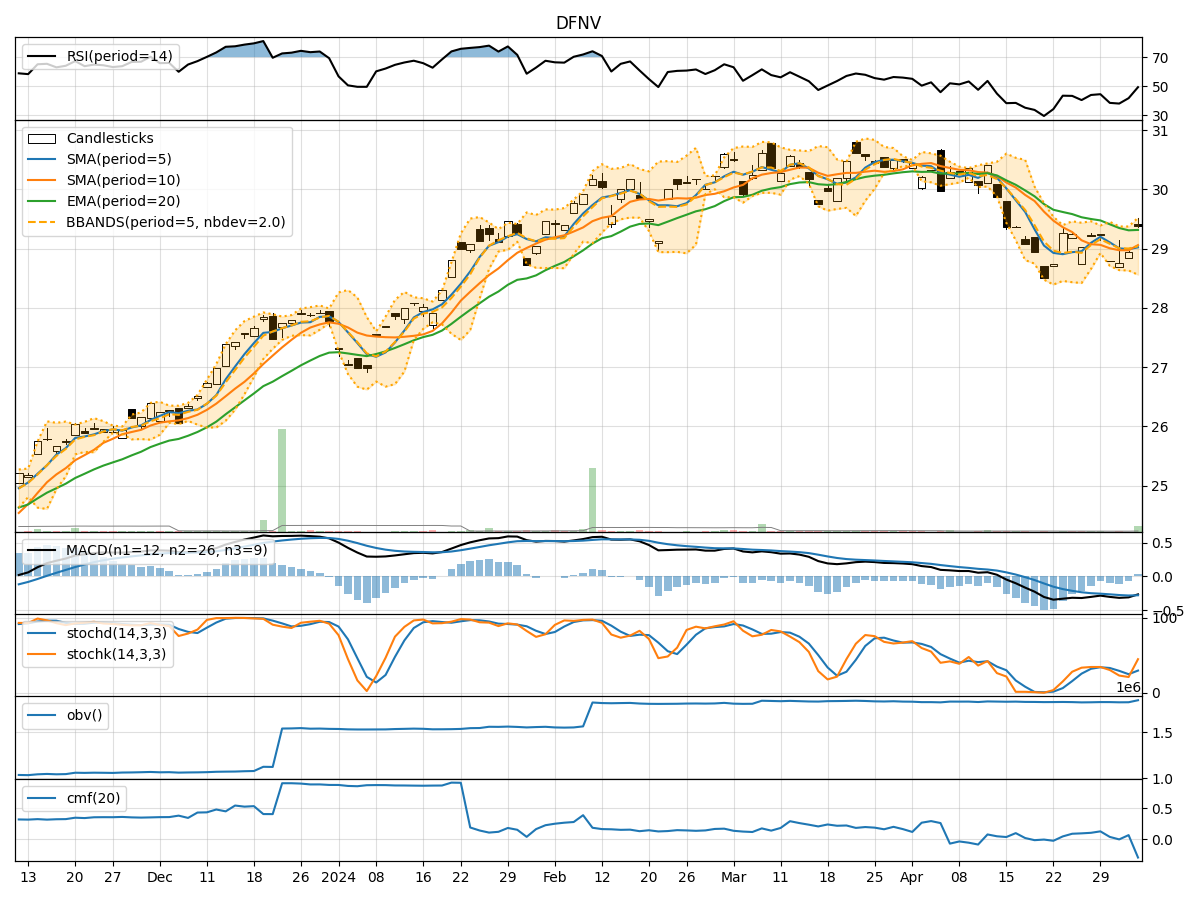
- Moving Averages (MA): The 5-day moving average has been consistently above the simple moving average (SMA) and exponential moving average (EMA) over the past 5 days, indicating a short-term uptrend.
- MACD: The MACD line has been negative but showing signs of convergence towards the signal line, suggesting a potential reversal in the downtrend.
- MACD Histogram: The histogram has been gradually decreasing, indicating a weakening bearish momentum.
Momentum Indicators:
- RSI: The Relative Strength Index (RSI) has been fluctuating around the neutral level of 50, indicating a lack of strong momentum in either direction.
- Stochastic Oscillator: Both %K and %D have been in the overbought zone, suggesting a potential reversal or consolidation phase.
- Williams %R: The Williams %R is hovering near the oversold territory, indicating a possible buying opportunity.
Volatility Indicators:
- Bollinger Bands: The stock price has been trading within the bands, with the bands narrowing in recent days, indicating decreasing volatility.
- Bollinger %B: The %B indicator is currently above 0.5, suggesting a bullish sentiment in the short term.
Volume Indicators:
- On-Balance Volume (OBV): The OBV has been relatively stable, indicating a balance between buying and selling pressure.
- Chaikin Money Flow (CMF): The CMF has been negative, reflecting a net outflow of money from the stock.
Key Observations:
- The trend indicators suggest a potential reversal in the short-term downtrend.
- Momentum indicators show mixed signals, with RSI indicating neutrality and stochastic oscillators hinting at a possible reversal.
- Volatility indicators point towards decreasing volatility and a potential consolidation phase.
- Volume indicators reflect a balanced buying and selling pressure with a slight negative bias.
Conclusion:
Based on the analysis of the technical indicators, the next few days for DFNV stock price movement could see sideways consolidation with a slight bullish bias. Investors may consider monitoring the MACD for a potential bullish crossover, while also keeping an eye on the stochastic oscillators for confirmation of a reversal. It is advisable to wait for more definitive signals before making significant trading decisions.