Technical Analysis of DFSB 2024-05-10
Overview:
In analyzing the technical indicators for DFSB stock over the last 5 days, we will delve into the trend, momentum, volatility, and volume indicators to provide a comprehensive outlook on the possible stock price movement in the coming days. By examining these key indicators, we aim to offer valuable insights and predictions for potential investors.
Trend Indicators:
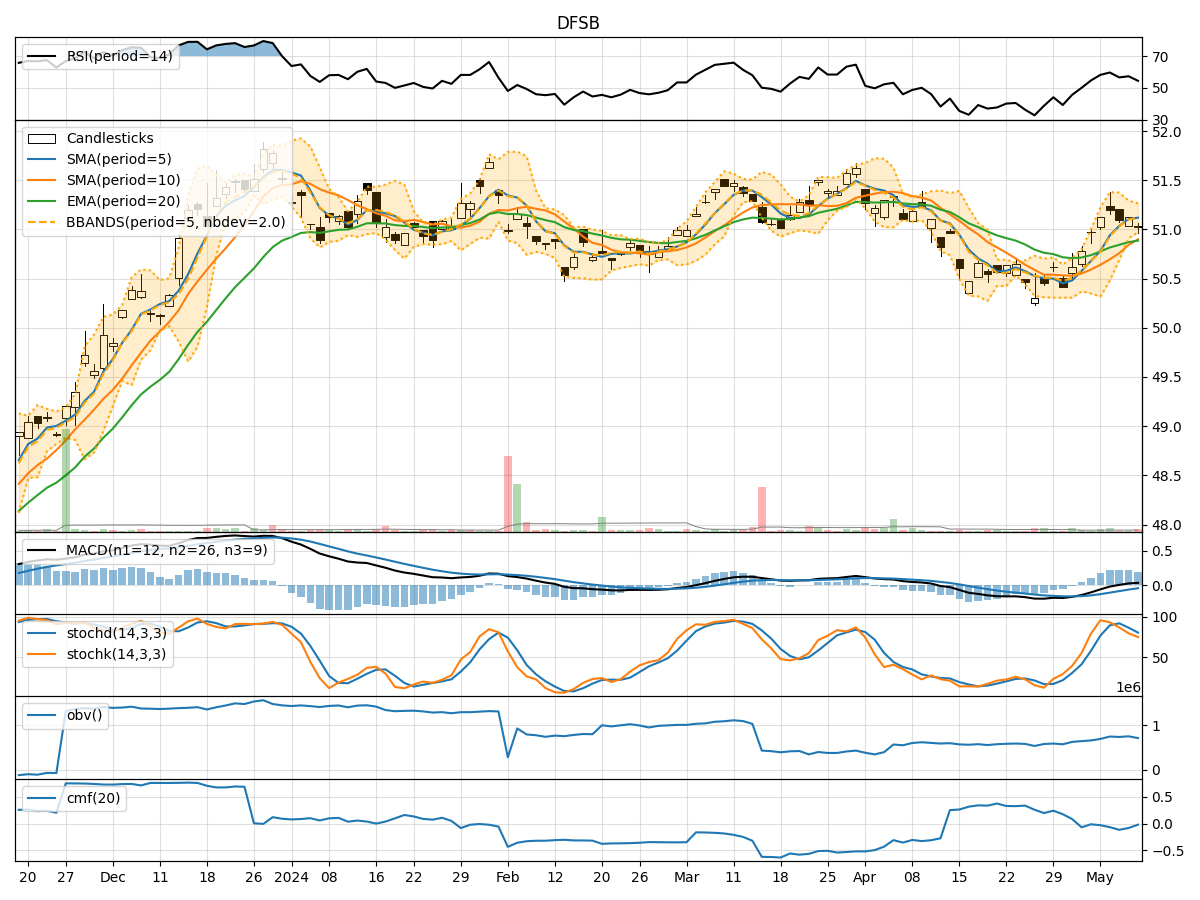
- Moving Averages (MA): The 5-day Moving Average (MA) has been consistently above the Simple Moving Average (SMA) and Exponential Moving Average (EMA), indicating a bullish trend.
- MACD: The MACD line has been consistently above the signal line, suggesting a positive momentum in the stock price.
- MACD Histogram: The MACD Histogram has been gradually decreasing but remains in positive territory, indicating a slight loss in momentum.
Momentum Indicators:
- RSI: The Relative Strength Index (RSI) has been fluctuating around the 50 level, indicating a neutral momentum in the stock.
- Stochastic Oscillator: Both %K and %D levels of the Stochastic Oscillator have been declining, signaling a potential bearish momentum.
- Williams %R: The Williams %R indicator has been in oversold territory, suggesting a possible reversal in the stock price.
Volatility Indicators:
- Bollinger Bands: The Bollinger Bands have been narrowing, indicating decreasing volatility in the stock price.
- Bollinger %B: The %B indicator has been hovering around the middle range, suggesting a neutral volatility outlook.
Volume Indicators:
- On-Balance Volume (OBV): The OBV has been fluctuating, indicating indecision among investors regarding the stock.
- Chaikin Money Flow (CMF): The CMF has been negative, suggesting a bearish money flow in the stock.
Key Observations:
- The trend indicators point towards a bullish sentiment in the stock price.
- Momentum indicators show a mixed signal with a slight bearish bias.
- Volatility indicators indicate decreasing volatility in the stock.
- Volume indicators suggest a negative money flow and indecision among investors.
Conclusion:
Based on the analysis of the technical indicators, the next few days' possible stock price movement for DFSB is likely to be sideways with a slight bearish bias. Investors should exercise caution and closely monitor the price action for any potential trend reversal. It is advisable to wait for more confirmation from the indicators before making any significant trading decisions.