Technical Analysis of DFSD 2024-05-10
Overview:
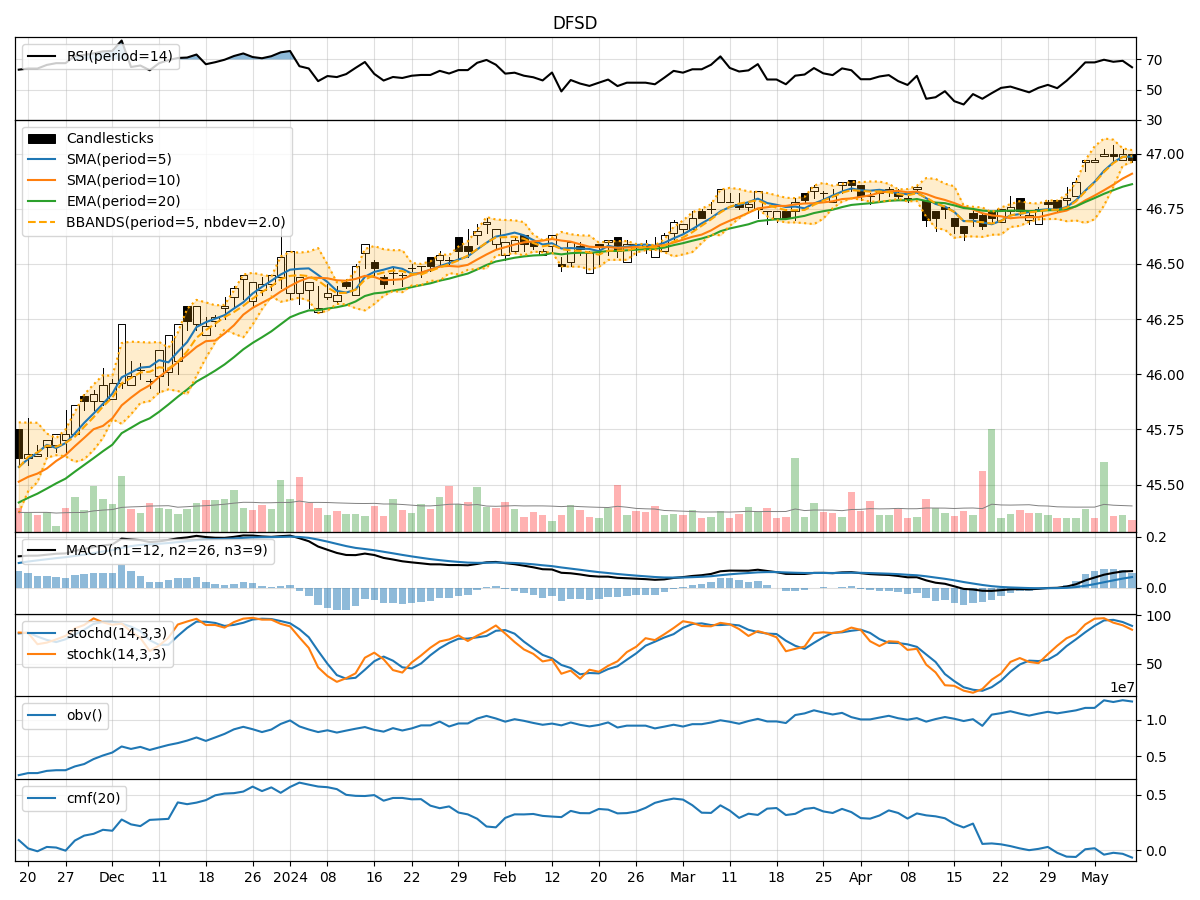
In the last 5 trading days, the stock price of DFSD has shown relatively stable movements with minor fluctuations. Various technical indicators have been analyzed to provide insights into the potential future price movement of the stock. The analysis covers trend indicators, momentum indicators, volatility indicators, and volume indicators to offer a comprehensive view of the stock's performance.
Trend Indicators:
- Moving Averages (MA): The 5-day MA has been consistently above the closing price, indicating a short-term uptrend. Both the SMA(10) and EMA(20) have shown a positive slope, suggesting a bullish trend.
- MACD: The MACD line has been consistently above the signal line, indicating bullish momentum in the stock price.
- MACD Histogram: The MACD histogram has been increasing over the past few days, signaling strengthening bullish momentum.
Momentum Indicators:
- RSI: The RSI has been fluctuating around the overbought territory, indicating strong buying pressure in the stock.
- Stochastic Oscillator: Both %K and %D lines of the stochastic oscillator have been in the overbought zone, suggesting a potential reversal or consolidation.
- Williams %R: The Williams %R has been consistently in the oversold territory, indicating a potential reversal to the upside.
Volatility Indicators:
- Bollinger Bands: The stock price has been trading within the Bollinger Bands, with the bands narrowing, indicating decreasing volatility.
- Bollinger %B: The %B indicator has been hovering around the middle range, suggesting a balanced market sentiment.
Volume Indicators:
- On-Balance Volume (OBV): The OBV has shown mixed signals with fluctuations in volume, indicating indecision among market participants.
- Chaikin Money Flow (CMF): The CMF has been negative, suggesting selling pressure in the stock.
Key Observations:
- The stock is currently in a short-term uptrend based on moving averages and MACD.
- Momentum indicators suggest a potential reversal or consolidation due to overbought conditions.
- Volatility has been decreasing, indicating a possible period of consolidation.
- Volume indicators show mixed signals, reflecting uncertainty in market sentiment.
Conclusion:
Based on the analysis of technical indicators, the next few days' possible stock price movement for DFSD is likely to experience a period of consolidation. The stock may trade within a narrow range as momentum indicators signal a potential reversal or pause in the current uptrend. Traders should exercise caution and wait for clearer signals before taking significant positions.