Technical Analysis of DFSI 2024-05-10
Overview:
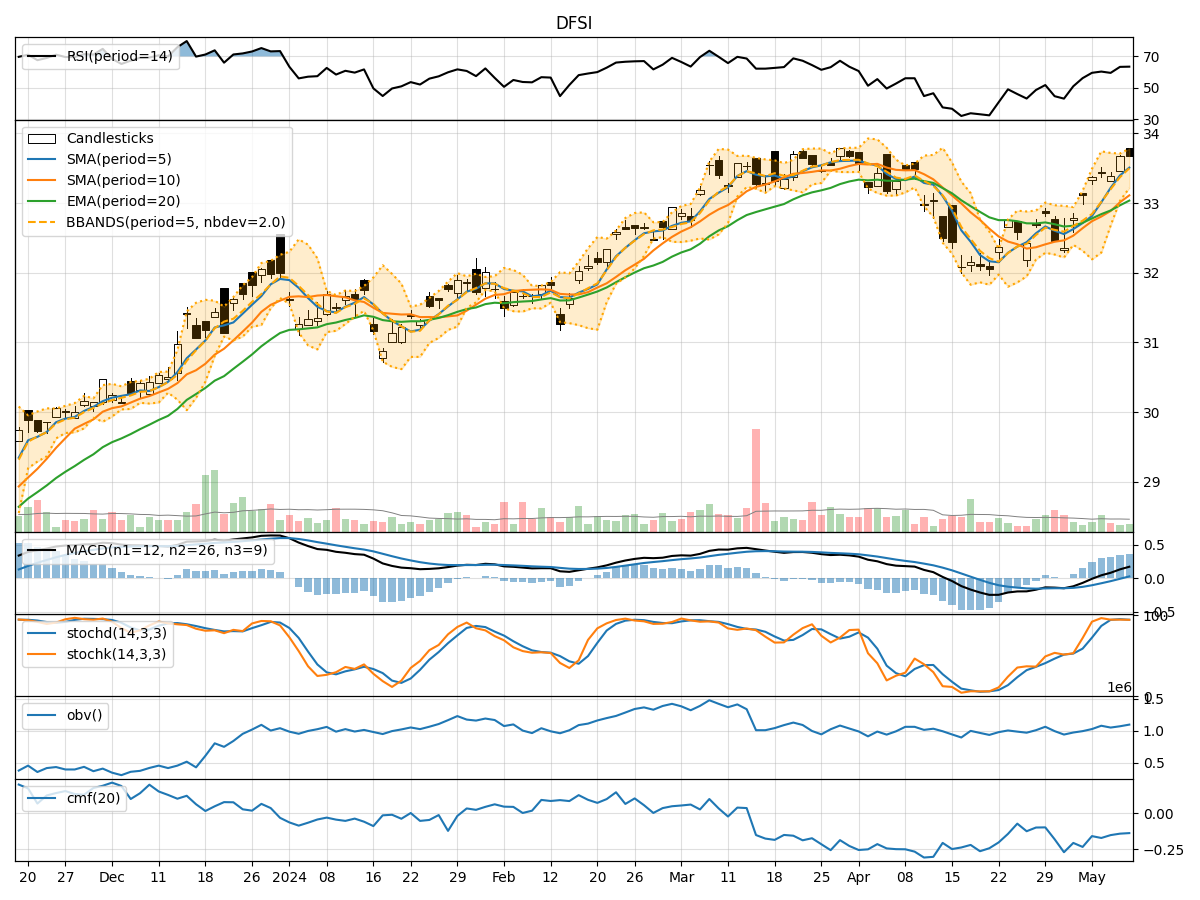
In analyzing the technical indicators for DFSI over the last 5 days, we will delve into the trend, momentum, volatility, and volume indicators to provide a comprehensive outlook on the possible stock price movement in the coming days. By examining these key aspects, we aim to offer valuable insights and predictions for potential investors.
Trend Analysis:
- Moving Averages (MA): The 5-day Moving Average (MA) has been consistently above the Simple Moving Average (SMA) and Exponential Moving Average (EMA), indicating a bullish trend.
- MACD: The MACD line has been consistently above the signal line, with both showing an upward trend, suggesting bullish momentum.
Momentum Analysis:
- RSI: The Relative Strength Index (RSI) has been hovering around 60-63, indicating a neutral to slightly bullish momentum.
- Stochastic Oscillator: Both %K and %D have been relatively high, suggesting a bullish sentiment in momentum.
Volatility Analysis:
- Bollinger Bands (BB): The stock price has been trading within the upper Bollinger Band (BBU), indicating an uptrend with increased volatility.
Volume Analysis:
- On-Balance Volume (OBV): The OBV has shown a consistent increase over the last 5 days, indicating accumulation by investors.
- Chaikin Money Flow (CMF): The CMF has been negative but improving, suggesting a potential shift towards buying pressure.
Key Observations:
- The trend indicators suggest a strong bullish sentiment with moving averages and MACD supporting an upward trajectory.
- Momentum indicators show a neutral to slightly bullish momentum, indicating potential room for further upside.
- Volatility indicators point towards an increasing volatility within an uptrend, which could lead to larger price movements.
- Volume indicators reflect positive accumulation by investors, supporting the bullish outlook.
Conclusion:
Based on the analysis of the technical indicators, the next few days are likely to see continued upward movement in the stock price of DFSI. The bullish trend supported by moving averages and MACD, coupled with positive momentum and increasing volatility, indicates a favorable environment for potential price appreciation. Investors may consider maintaining or initiating long positions in DFSI based on the current technical outlook.
Recommendation:
- Bullish View: Considering the overall positive technical signals, it is advisable to maintain a bullish stance on DFSI for the next few days.
- Potential Price Target: Based on the current trend and momentum, a potential price target could be set at a level above the recent highs, with careful monitoring of key support and resistance levels.
By combining the insights from trend, momentum, volatility, and volume indicators, investors can make informed decisions aligned with the prevailing market dynamics. It is essential to monitor the evolving technical signals and adjust strategies accordingly to capitalize on potential opportunities in the stock market.