Technical Analysis of DFSU 2024-05-10
Overview:
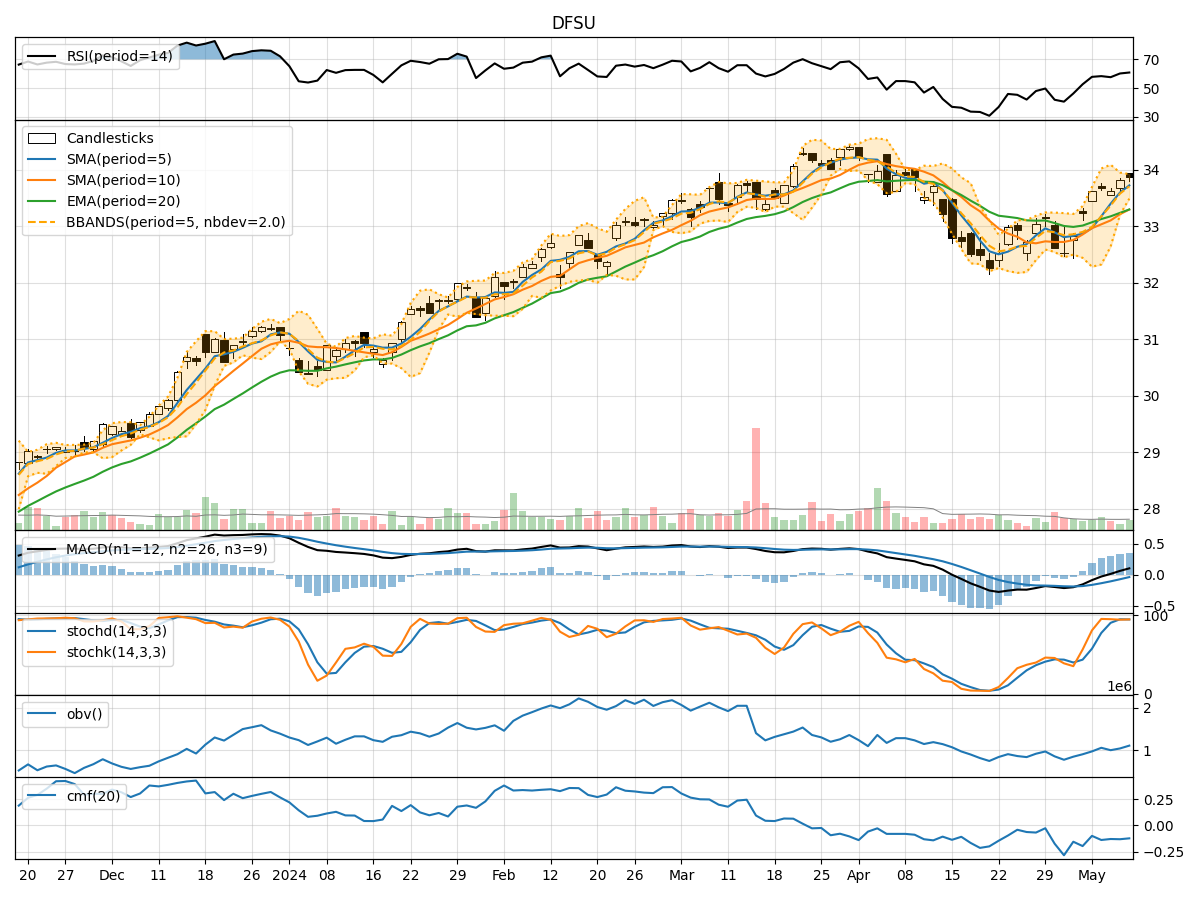
In analyzing the technical indicators for DFSU over the last 5 days, we will delve into the trend, momentum, volatility, and volume indicators to provide a comprehensive outlook on the possible stock price movement in the coming days.
Trend Analysis:
- Moving Averages (MA): The 5-day Moving Average (MA) has been trending upwards, indicating a positive momentum in the stock price.
- MACD: The MACD line has been consistently above the signal line, suggesting a bullish trend in the stock.
- EMA: The Exponential Moving Average (EMA) has been steadily increasing, further supporting the bullish sentiment in the stock.
Momentum Analysis:
- RSI: The Relative Strength Index (RSI) has been in the overbought territory, indicating a strong bullish momentum in the stock.
- Stochastic Oscillator: Both %K and %D lines of the Stochastic Oscillator have been in the overbought zone, signaling a potential reversal or consolidation in the stock price.
- Williams %R: The Williams %R is also in the oversold region, suggesting a possible pullback in the stock price.
Volatility Analysis:
- Bollinger Bands: The Bollinger Bands are narrowing, indicating decreasing volatility in the stock price.
- Bollinger %B: The %B indicator is above 0.8, suggesting that the stock is trading near the upper Bollinger Band, potentially indicating an overbought condition.
Volume Analysis:
- On-Balance Volume (OBV): The OBV has been declining, indicating that selling pressure may be increasing in the stock.
- Chaikin Money Flow (CMF): The CMF has been negative, suggesting that money may be flowing out of the stock.
Conclusion:
Based on the analysis of the technical indicators, the stock of DFSU is currently exhibiting strong bullish momentum, supported by the upward trend in moving averages and MACD. However, the overbought conditions in RSI and Stochastic Oscillator, coupled with the declining OBV and negative CMF, suggest a potential reversal or consolidation in the stock price in the coming days.
Key Points:
- Trend: Upward
- Momentum: Overbought, potential reversal
- Volatility: Decreasing
- Volume: Selling pressure increasing
Recommendation:
Given the mixed signals from the technical indicators, it is advisable to exercise caution in trading DFSU. Consider waiting for a clearer signal or confirmation of a trend reversal before making any significant trading decisions.