Technical Analysis of DFSV 2024-05-10
Overview:
In analyzing the technical indicators for DFSV over the last 5 days, we will delve into the trend, momentum, volatility, and volume indicators to provide a comprehensive outlook on the possible stock price movement. By examining these key aspects, we aim to offer valuable insights and predictions for the upcoming days.
Trend Analysis:
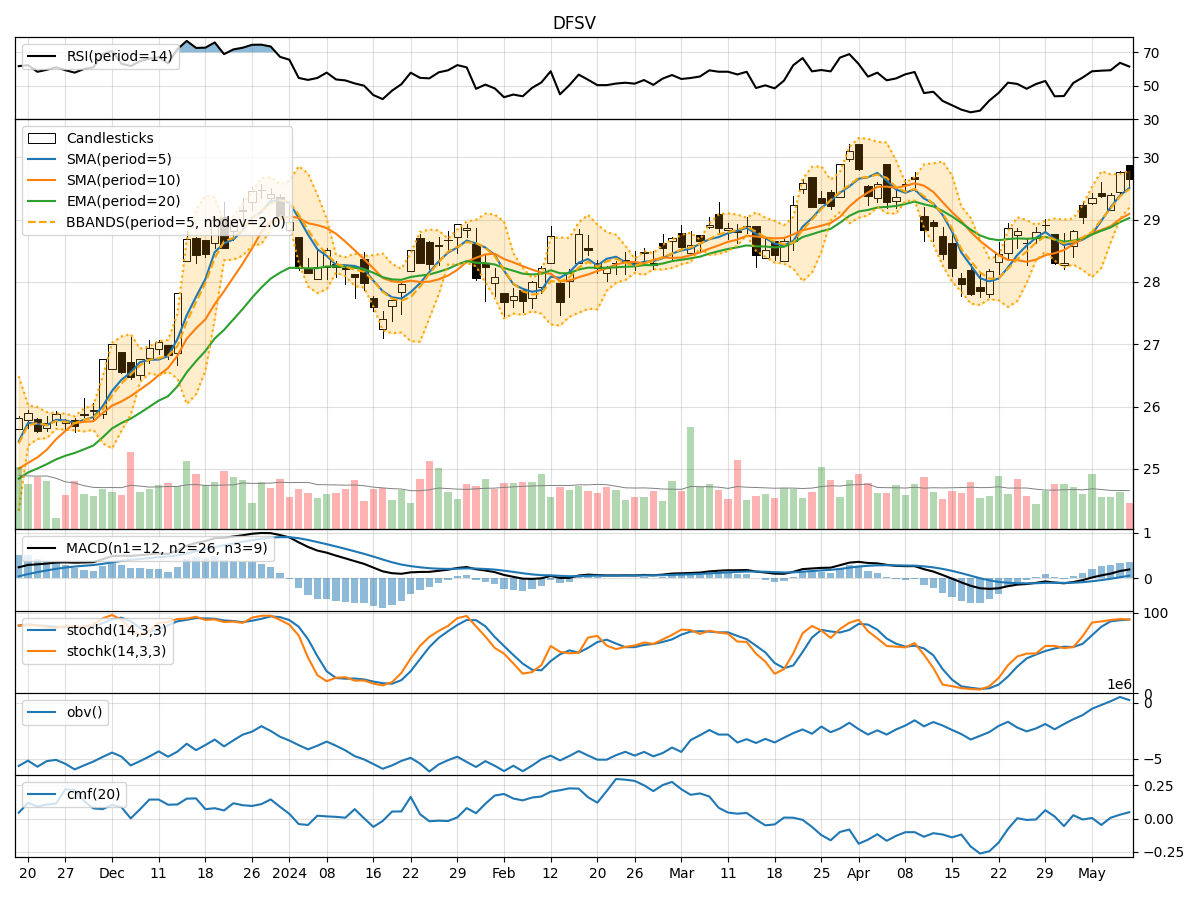
- Moving Averages (MA): The 5-day Moving Average (MA) has been consistently above the Simple Moving Average (SMA) and Exponential Moving Average (EMA), indicating a bullish trend.
- MACD: The MACD line has been consistently above the signal line, with the MACD histogram showing an increasing positive trend, suggesting bullish momentum.
Momentum Analysis:
- RSI: The Relative Strength Index (RSI) has been fluctuating around the 60-70 range, indicating a neutral to slightly bullish momentum.
- Stochastic Oscillator: Both %K and %D lines of the Stochastic Oscillator have been in the overbought zone, suggesting a potential reversal or consolidation.
Volatility Analysis:
- Bollinger Bands (BB): The stock price has been trading within the Bollinger Bands, with the bands narrowing, indicating decreasing volatility.
- Bollinger %B (BBP): The %B indicator has been hovering around 0.7-0.9, suggesting the stock is trading closer to the upper band.
Volume Analysis:
- On-Balance Volume (OBV): The OBV has shown a slight increase over the last 5 days, indicating accumulation by investors.
- Chaikin Money Flow (CMF): The CMF has been positive, reflecting buying pressure in the stock.
Key Observations and Opinions:
- Trend: The trend indicators suggest a strong bullish sentiment in the stock.
- Momentum: The momentum indicators show a neutral to slightly bullish stance, with a possibility of a reversal due to overbought conditions.
- Volatility: Volatility has been decreasing, indicating a potential period of consolidation.
- Volume: The volume indicators point towards accumulation and positive buying pressure.
Conclusion:
Based on the analysis of the technical indicators, the next few days for DFSV are likely to see continued upward movement in the stock price. The bullish trend, supported by positive momentum and volume indicators, suggests that the stock may experience further gains. However, caution is advised as the stock is currently in the overbought zone, and a potential consolidation or pullback could occur in the near term. Investors should closely monitor the price action and key support/resistance levels for timely decision-making.