Technical Analysis of DFUS 2024-05-10
Overview:
In analyzing the technical indicators for DFUS over the last 5 days, we will delve into the trend, momentum, volatility, and volume indicators to provide a comprehensive outlook on the possible stock price movement. By examining these key indicators, we aim to offer valuable insights and predictions for the upcoming days.
Trend Analysis:
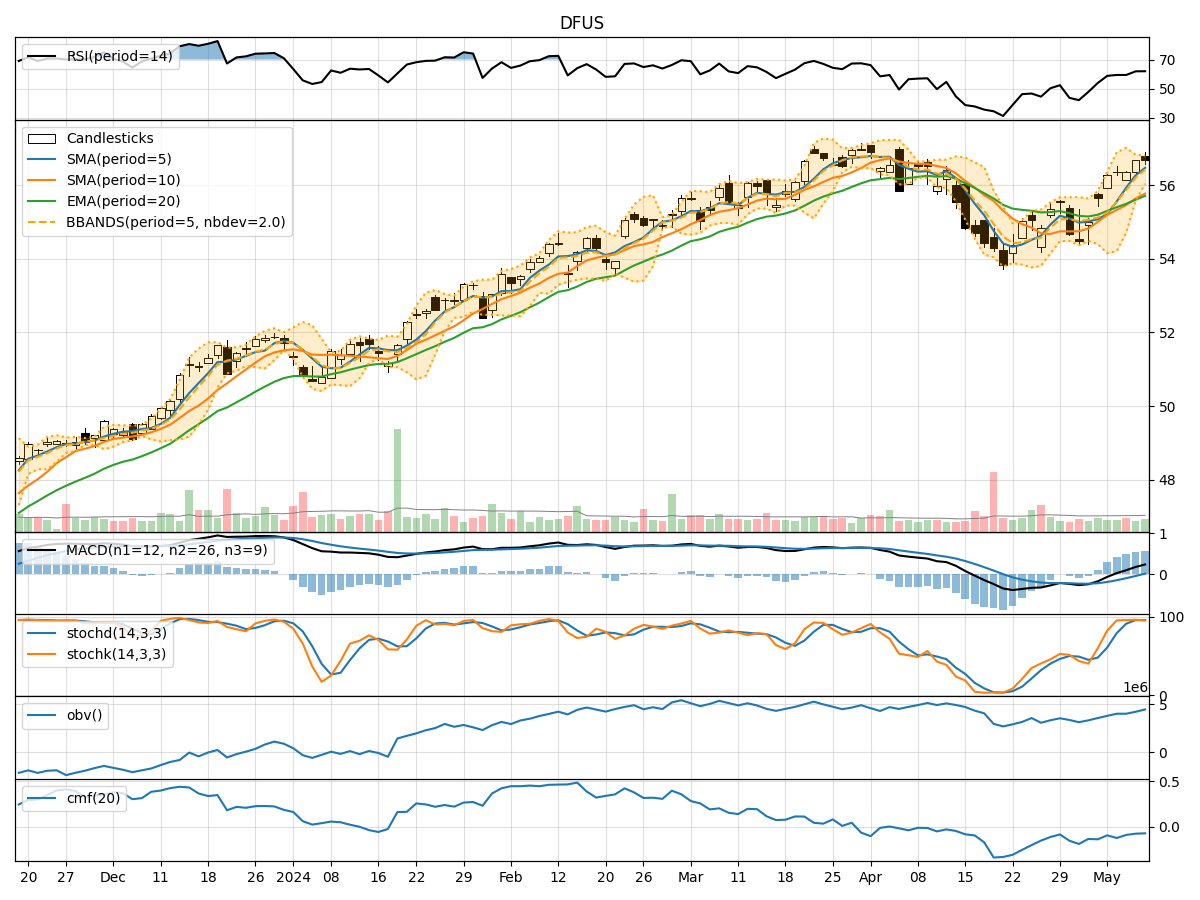
- Moving Averages (MA): The 5-day Moving Average (MA) has been consistently above the Simple Moving Average (SMA) and Exponential Moving Average (EMA), indicating a bullish trend.
- MACD: The MACD line has been consistently above the signal line, with the MACD Histogram showing an increasing positive trend, suggesting bullish momentum.
Momentum Analysis:
- RSI: The Relative Strength Index (RSI) has been in the overbought territory, indicating strong buying momentum.
- Stochastic Oscillator: Both %K and %D have been in the overbought zone, suggesting a potential reversal or consolidation.
- Williams %R: The Williams %R is in the oversold region, signaling a possible buying opportunity.
Volatility Analysis:
- Bollinger Bands (BB): The stock price has been trading within the upper Bollinger Band, indicating high volatility.
- Bollinger Band Width: The Band Width has been narrowing, suggesting a potential decrease in volatility.
Volume Analysis:
- On-Balance Volume (OBV): The OBV has been increasing, indicating strong buying pressure.
- Chaikin Money Flow (CMF): The CMF has been negative, suggesting a slight outflow of money from the stock.
Key Observations and Opinions:
- Trend: The trend indicators suggest a strong bullish sentiment in the short term.
- Momentum: The momentum indicators show mixed signals, with RSI in overbought territory and Stochastic Oscillator signaling potential reversal.
- Volatility: The narrowing Bollinger Band Width indicates a possible decrease in volatility.
- Volume: The increasing OBV reflects strong buying pressure, while the negative CMF signals a slight outflow of money.
Conclusion:
Based on the analysis of the technical indicators, the next few days' possible stock price movement for DFUS is likely to be upward with a potential for consolidation. Traders should closely monitor the Stochastic Oscillator for any reversal signals and keep an eye on the Bollinger Bands for potential breakout or breakdown levels. Overall, the bullish trend supported by strong buying pressure indicates a favorable outlook for the stock in the short term.