Technical Analysis of DFUV 2024-05-10
Overview:
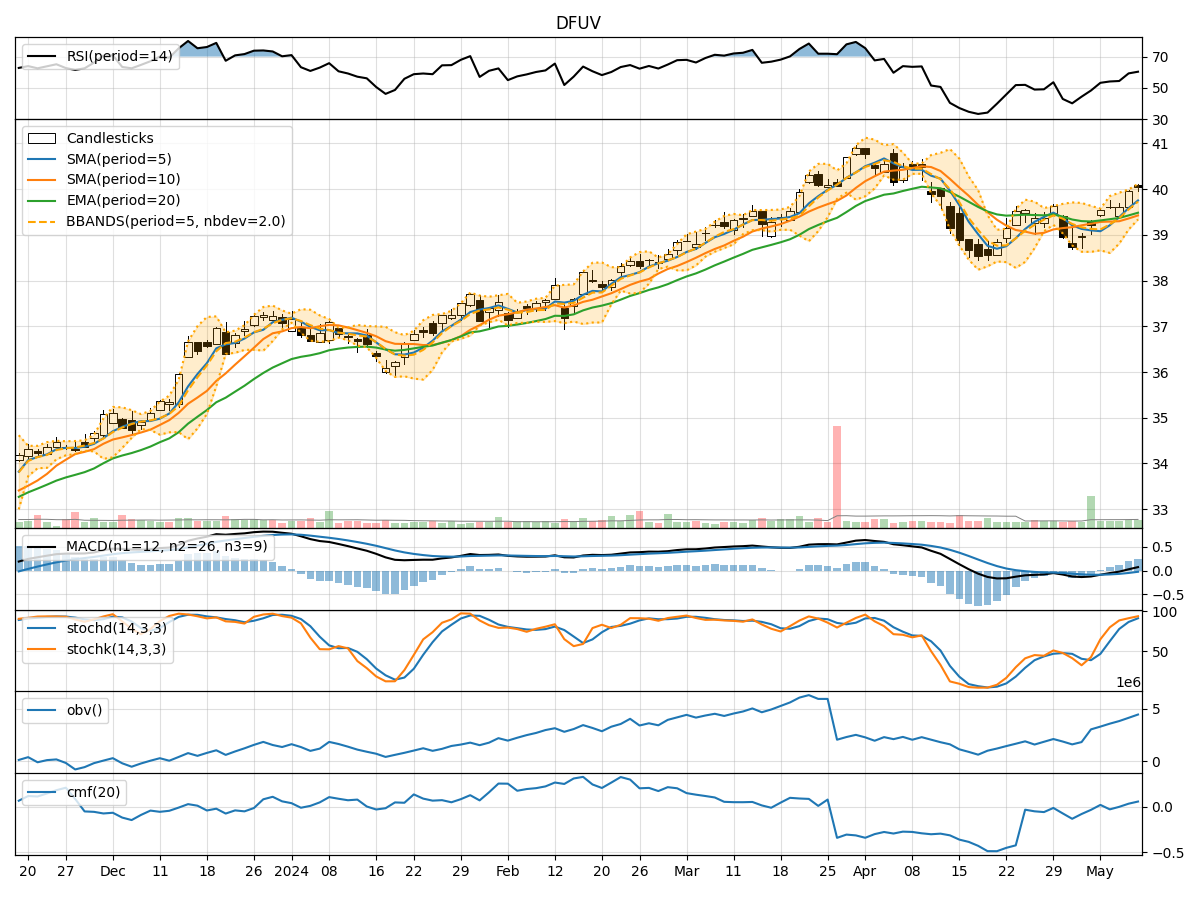
In analyzing the technical indicators for DFUV over the last 5 days, we will delve into the trend, momentum, volatility, and volume indicators to provide a comprehensive outlook on the possible stock price movement. By examining these key aspects, we aim to offer valuable insights and predictions for the upcoming days.
Trend Indicators:
- Moving Averages (MA): The 5-day MA has been trending above the closing prices, indicating a short-term bullish momentum.
- MACD: The MACD line has been consistently above the signal line, suggesting a positive trend in momentum.
- RSI: The RSI values have been gradually increasing, reflecting strengthening bullish momentum.
Momentum Indicators:
- Stochastic Oscillator: Both %K and %D values have been in the overbought territory, signaling a potential reversal or consolidation.
- Williams %R: The indicator has been in the oversold region, indicating a possible bullish reversal.
Volatility Indicators:
- Bollinger Bands (BB): The stock price has been consistently trading above the middle band, indicating an uptrend.
- BB Width: The bands have been narrowing, suggesting a decrease in volatility.
Volume Indicators:
- On-Balance Volume (OBV): The OBV has been steadily increasing, indicating accumulation by investors.
- Chaikin Money Flow (CMF): The CMF has been positive, reflecting buying pressure in the stock.
Key Observations:
- The trend indicators suggest a bullish sentiment in the short term.
- Momentum indicators show signs of potential overbought conditions, hinting at a possible reversal or consolidation.
- Volatility indicators indicate a narrowing range, which could lead to a period of consolidation.
- Volume indicators point towards increasing buying interest in the stock.
Conclusion:
Based on the analysis of the technical indicators, the next few days' possible stock price movement for DFUV is likely to be sideways or consolidating with a slight upward bias. Traders should monitor the overbought signals from the momentum indicators for potential reversals or corrections. Additionally, the narrowing Bollinger Bands suggest a period of consolidation, while the increasing OBV and positive CMF indicate underlying strength in the stock. Overall, a cautious approach with a focus on key support and resistance levels is recommended in the upcoming trading sessions.