Technical Analysis of DFVE 2024-05-10
Overview:
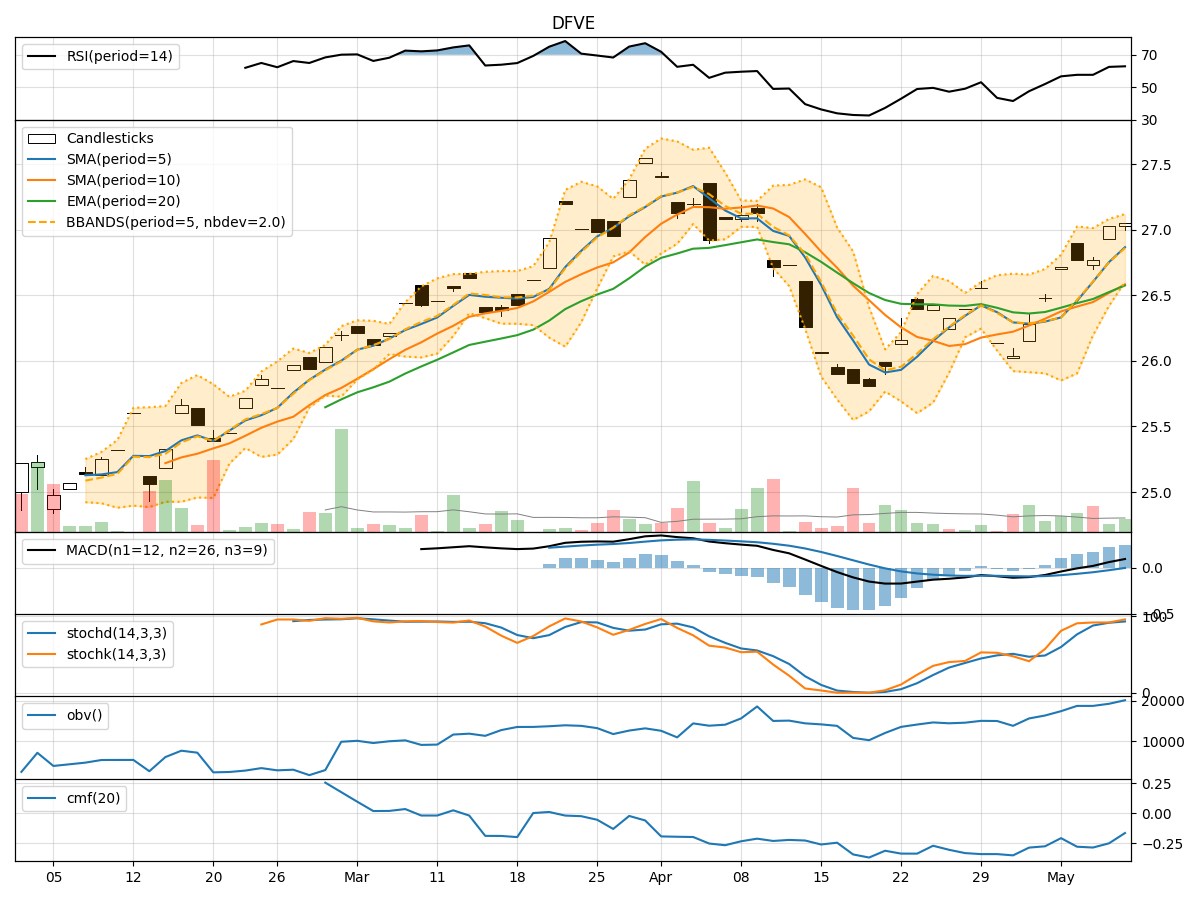
In analyzing the technical indicators for DFVE over the last 5 days, we will delve into the trends, momentum, volatility, and volume aspects to provide a comprehensive outlook on the possible stock price movement. By examining key indicators such as moving averages, MACD, RSI, Bollinger Bands, and OBV, we aim to offer valuable insights and predictions for the upcoming days.
Trend Analysis:
- Moving Averages (MA): The 5-day MA has been consistently above the closing prices, indicating a bullish trend.
- MACD: The MACD line has been above the signal line, suggesting a positive momentum in the stock price.
Key Observation: The trend indicators point towards an upward movement in the stock price.
Momentum Analysis:
- RSI: The RSI values have been in the range of 50-70, indicating a moderate bullish momentum.
- Stochastic Oscillator: Both %K and %D values are in the overbought zone, signaling a potential reversal.
Key Observation: Momentum indicators suggest a potential consolidation or reversal in the stock price.
Volatility Analysis:
- Bollinger Bands (BB): The stock price has been trading within the bands, with the %B indicator hovering around 0.8.
Key Observation: Volatility indicators imply a stable price movement within the bands.
Volume Analysis:
- On-Balance Volume (OBV): The OBV has shown a slight increase over the last 5 days, indicating accumulation.
- Chaikin Money Flow (CMF): The CMF values have been negative, suggesting a bearish money flow.
Key Observation: Volume indicators reflect mixed signals with a slight bias towards bearish sentiment.
Conclusion:
Based on the analysis of the technical indicators, the next few days' possible stock price movement for DFVE is likely to exhibit upward momentum in the short term, supported by the bullish trend indicators. However, the overbought levels in the stochastic oscillator and negative CMF values indicate a potential consolidation or reversal in the near future. Traders should closely monitor the price action and volume dynamics to make informed decisions.
Key Takeaways:
- Trend: Upward
- Momentum: Consolidation/Reversal
- Volatility: Stable
- Volume: Mixed/Bearish
In conclusion, a cautious approach with proper risk management is advised, considering the mixed signals from the technical indicators.