Technical Analysis of DFVX 2024-05-10
Overview:
In analyzing the technical indicators for DFVX over the last 5 days, we will delve into the trend, momentum, volatility, and volume indicators to provide a comprehensive outlook on the possible stock price movement. By examining these key aspects, we aim to offer valuable insights and predictions for the upcoming days.
Trend Analysis:
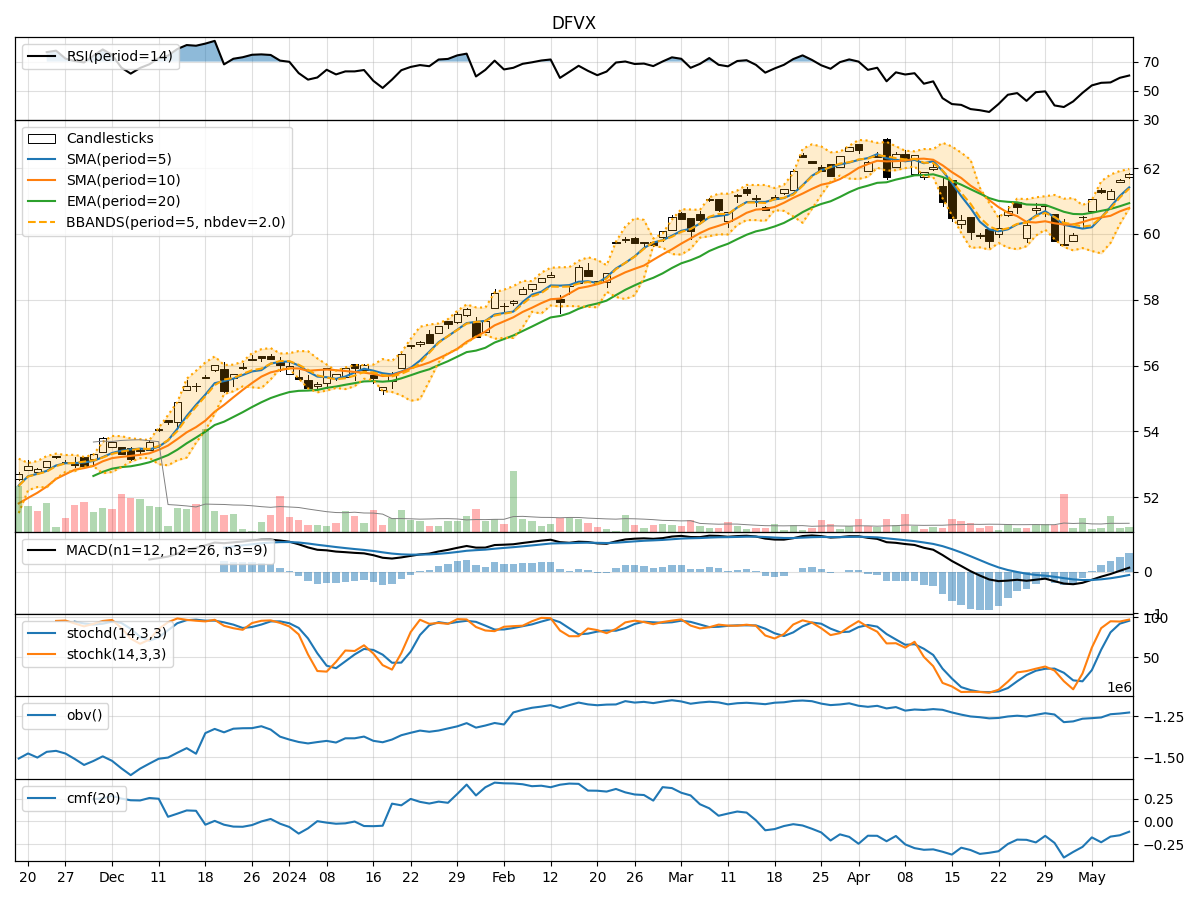
- Moving Averages (MA): The 5-day MA has been consistently above the closing prices, indicating a bullish trend.
- MACD: The MACD line has been above the signal line, suggesting a bullish momentum.
- RSI: The RSI has been trending upwards, indicating increasing buying pressure.
Key Observation: The trend indicators point towards a bullish sentiment in the stock price movement.
Momentum Analysis:
- Stochastic Oscillator: Both %K and %D have been in the overbought territory, signaling a strong bullish momentum.
- Williams %R: The indicator has been consistently below -20, indicating an overbought condition.
Key Observation: Momentum indicators suggest that the stock is currently in an overbought state.
Volatility Analysis:
- Bollinger Bands (BB): The stock price has been consistently trading above the middle band, indicating an uptrend.
- Bollinger %B: The %B indicator has been above 0.8, suggesting a high volatility period.
Key Observation: Volatility indicators imply a high volatility environment in the stock.
Volume Analysis:
- On-Balance Volume (OBV): The OBV has been showing a slight decrease, indicating some distribution.
- Chaikin Money Flow (CMF): The CMF has been negative, suggesting a bearish money flow.
Key Observation: Volume indicators hint at a slight bearish sentiment in the stock.
Conclusion:
Based on the analysis of the technical indicators, the overall outlook for DFVX in the next few days is as follows: - Trend: The trend indicators suggest a bullish sentiment. - Momentum: Momentum indicators indicate an overbought condition. - Volatility: Volatility indicators point towards high volatility. - Volume: Volume indicators hint at a slight bearish sentiment.
Final Verdict:
Considering the overall analysis, while the trend remains bullish, the overbought momentum and high volatility, coupled with the slight bearish volume signals, may lead to a potential consolidation or pullback in the stock price in the next few days. Traders should exercise caution and closely monitor the price action for any signs of a reversal or continuation of the current trend.