Technical Analysis of DGIN 2024-05-10
Overview:
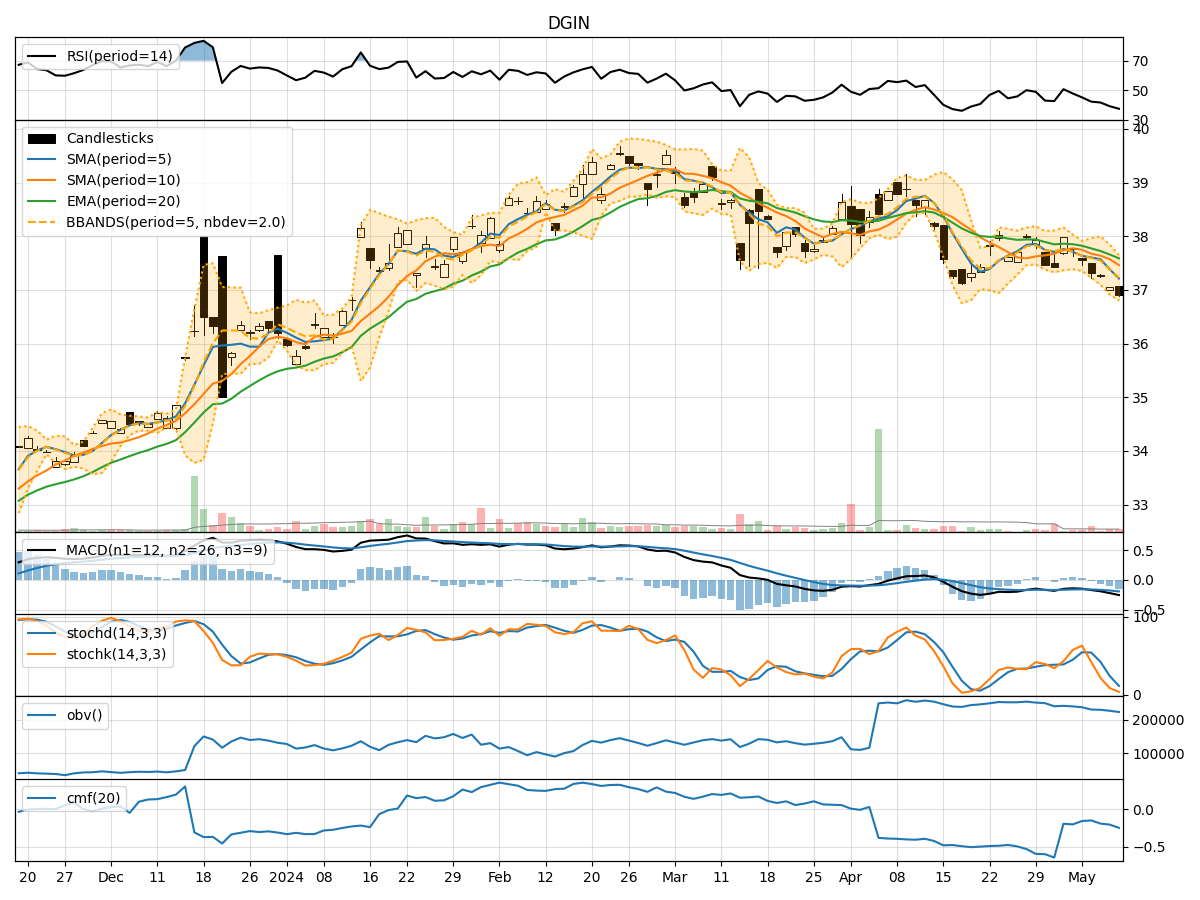
In analyzing the technical indicators for DGIN over the last 5 days, we will delve into the trend, momentum, volatility, and volume indicators to provide a comprehensive outlook on the possible stock price movement in the coming days.
Trend Analysis:
- Moving Averages (MA): The 5-day MA has been consistently below the closing prices, indicating a short-term downtrend.
- MACD: The MACD line has been decreasing, with the MACD histogram showing a negative trend, suggesting a bearish momentum.
Momentum Analysis:
- RSI: The RSI has been declining, indicating weakening bullish momentum.
- Stochastic Oscillator: Both %K and %D have been decreasing, signaling a bearish momentum.
Volatility Analysis:
- Bollinger Bands (BB): The stock price has been trading within the lower Bollinger Band, suggesting a potential oversold condition.
Volume Analysis:
- On-Balance Volume (OBV): The OBV has been decreasing, indicating selling pressure.
- Chaikin Money Flow (CMF): The CMF has been negative, reflecting a lack of buying interest.
Key Observations:
- The stock is in a short-term downtrend based on moving averages and MACD.
- Momentum indicators like RSI and Stochastic Oscillator are showing bearish signals.
- Volatility is relatively low, with the stock trading near the lower Bollinger Band.
- Volume indicators suggest a lack of buying interest and increasing selling pressure.
Conclusion:
Based on the analysis of technical indicators, the stock is likely to continue its downward movement in the coming days. The bearish trend, coupled with weakening momentum and negative volume signals, indicates a high probability of further downside. Traders and investors should exercise caution and consider shorting or staying on the sidelines until there are clear signs of a trend reversal.