Technical Analysis of DGRS 2024-05-10
Overview:
In analyzing the technical indicators for DGRS over the last 5 days, we will delve into the trend, momentum, volatility, and volume indicators to provide a comprehensive outlook on the possible stock price movement in the coming days. By examining these key indicators, we aim to offer valuable insights and predictions for informed decision-making.
Trend Indicators:
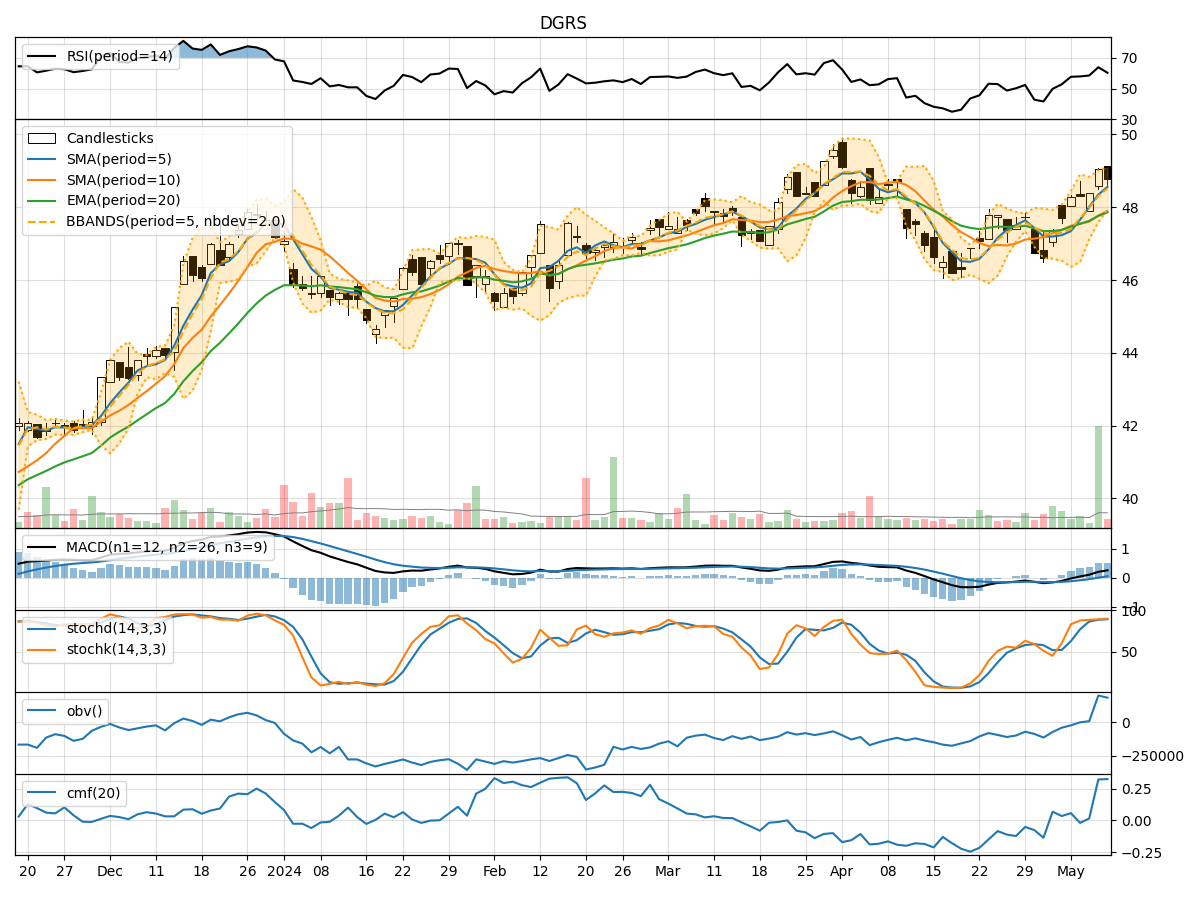
- Moving Averages (MA): The 5-day MA has been consistently above the longer-term SMAs and EMAs, indicating a bullish trend.
- MACD: The MACD line has been consistently above the signal line, suggesting upward momentum.
- MACD Histogram: The positive values of the MACD histogram indicate increasing bullish momentum.
Momentum Indicators:
- RSI: The RSI has been in the overbought territory, indicating a strong bullish momentum.
- Stochastic Oscillator: Both %K and %D have been in the overbought zone, signaling a strong buying pressure.
- Williams %R: The indicator has been in the oversold region, suggesting a potential reversal to the upside.
Volatility Indicators:
- Bollinger Bands: The price has been trading within the bands, with the upper band acting as a resistance level.
- Bollinger %B: The %B indicator has been fluctuating around 0.7, indicating a moderate level of volatility.
Volume Indicators:
- On-Balance Volume (OBV): The OBV has shown a consistent increase, reflecting strong buying volume.
- Chaikin Money Flow (CMF): The CMF has been positive, indicating a bullish money flow into the stock.
Key Observations and Opinions:
- Trend: The trend indicators suggest a strong bullish sentiment in the stock.
- Momentum: Momentum indicators confirm the bullish trend with overbought conditions.
- Volatility: Volatility has been moderate, with the price consolidating within the Bollinger Bands.
- Volume: Increasing OBV and positive CMF indicate strong buying interest in the stock.
Conclusion:
Based on the analysis of the technical indicators, the next few days' possible stock price movement for DGRS is likely to continue in an upward direction. The bullish trend, supported by strong momentum and buying volume, suggests that the stock may experience further price appreciation. Traders and investors could consider buying opportunities in anticipation of potential price gains. However, it is essential to monitor the indicators closely for any signs of reversal or consolidation in the market.