Technical Analysis of DGRW 2024-05-10
Overview:
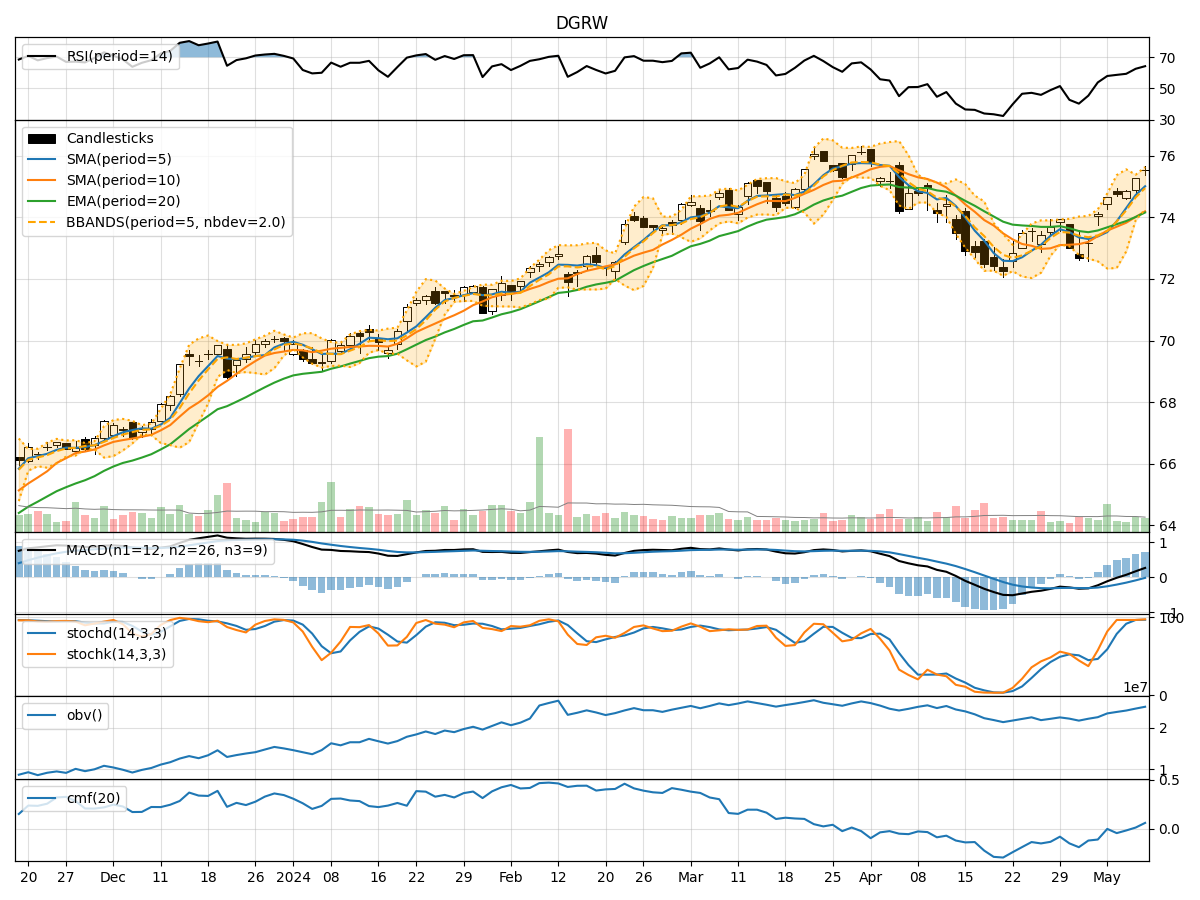
In analyzing the technical indicators for DGRW over the last 5 days, we will delve into the trend, momentum, volatility, and volume indicators to provide a comprehensive outlook on the possible stock price movement in the coming days. By examining these key aspects, we aim to offer valuable insights and predictions for potential investors.
Trend Indicators:
- Moving Averages (MA): The 5-day MA has been consistently above the 10-day SMA, indicating a short-term bullish trend. The EMA(20) has been steadily increasing, reflecting positive momentum.
- MACD: The MACD line has been above the signal line for the past 5 days, suggesting bullish momentum.
- Conclusion: The trend indicators point towards an upward trend in the stock price.
Momentum Indicators:
- RSI: The RSI has been gradually increasing and is currently in the overbought territory, indicating strong buying momentum.
- Stochastic Oscillator: Both %K and %D have been in the overbought zone, signaling a potential reversal.
- Williams %R: The indicator has been fluctuating but remains in the oversold region.
- Conclusion: Momentum indicators suggest a potential pullback or consolidation in the stock price.
Volatility Indicators:
- Bollinger Bands: The stock price has been trading within the bands, with the upper band acting as resistance and the lower band as support.
- Conclusion: Volatility indicators imply a sideways movement or consolidation in the near term.
Volume Indicators:
- On-Balance Volume (OBV): The OBV has been increasing, indicating accumulation by investors.
- Chaikin Money Flow (CMF): The CMF has been negative but improving, suggesting a potential shift towards buying pressure.
- Conclusion: Volume indicators signal positive accumulation and a potential bullish sentiment.
Overall Conclusion:
Based on the analysis of trend, momentum, volatility, and volume indicators, the stock of DGRW is likely to experience a short-term consolidation or pullback in the coming days. While the trend indicators point to an upward trajectory, momentum indicators suggest a potential reversal or pause in the current trend. Volatility indicators indicate a sideways movement, while volume indicators signal positive accumulation.
Recommendation:
Considering the mixed signals from different indicators, it is advisable for investors to exercise caution and closely monitor the stock price movement. It may be prudent to wait for further confirmation of a clear direction before making significant trading decisions. Additionally, keeping an eye on key support and resistance levels identified by the technical indicators can help in determining entry and exit points.
Disclaimer:
This analysis is based solely on technical indicators and historical data, and it is essential to consider other fundamental factors and market dynamics before making any investment decisions. Consulting with a financial advisor or conducting further research is recommended to gain a holistic view of the stock's potential performance.