Technical Analysis of DGS 2024-05-10
Overview:
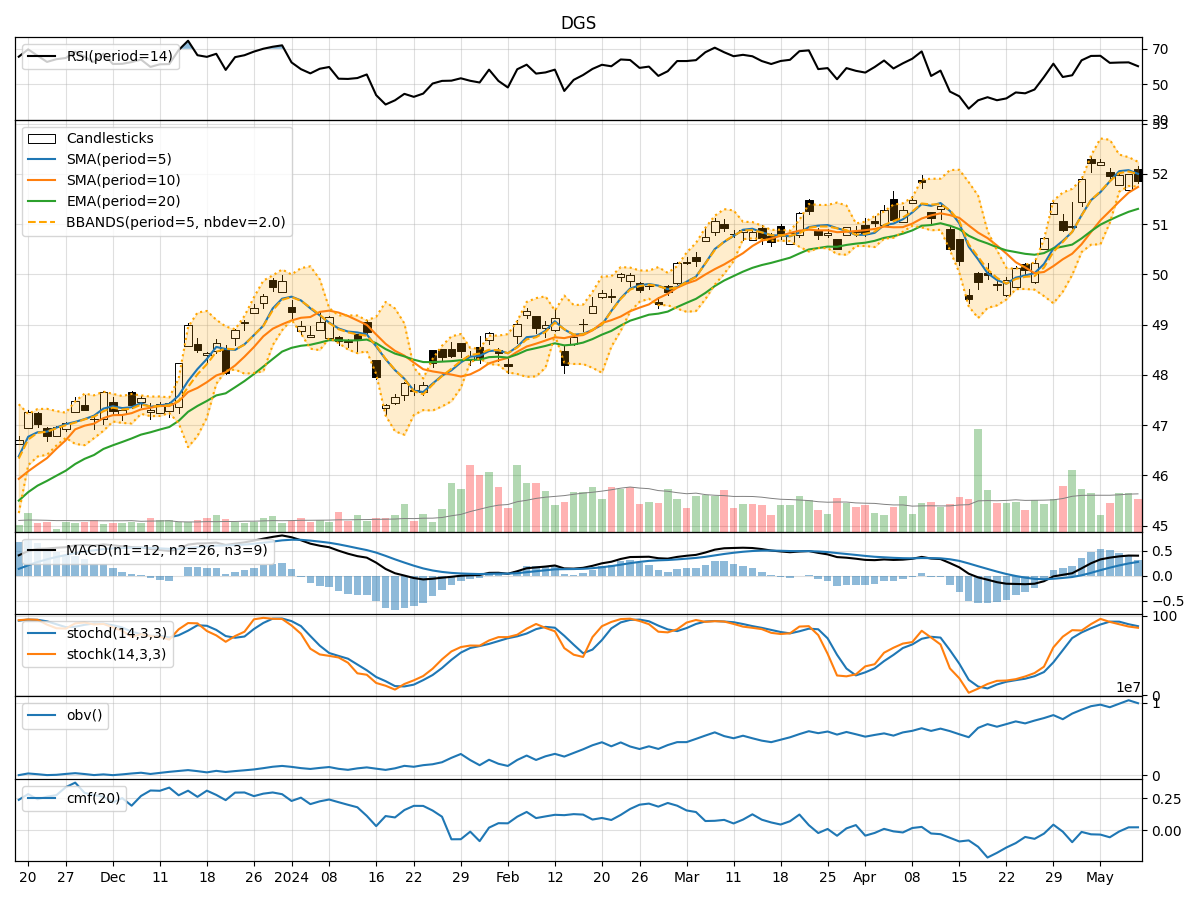
In analyzing the technical indicators for DGS stock over the last 5 days, we will delve into the trends, momentum, volatility, and volume indicators to provide a comprehensive outlook on the possible stock price movement in the coming days. By examining these key aspects, we aim to offer valuable insights and predictions for potential investors.
Trend Analysis:
- Moving Averages (MA): The 5-day Moving Average (MA) has been consistently above the Simple Moving Average (SMA) and Exponential Moving Average (EMA), indicating a bullish trend.
- MACD: The MACD line has been above the signal line, with both lines showing an upward trend, suggesting positive momentum in the stock price.
Momentum Analysis:
- RSI: The Relative Strength Index (RSI) has been in the overbought territory, indicating a strong bullish momentum.
- Stochastic Oscillator: Both %K and %D have been decreasing but remain in the overbought zone, signaling a potential reversal or consolidation.
Volatility Analysis:
- Bollinger Bands (BB): The stock price has been trading within the Bollinger Bands, with the bands narrowing, suggesting a period of low volatility.
Volume Analysis:
- On-Balance Volume (OBV): The OBV has been fluctuating but showing a slight increase, indicating some accumulation by investors.
- Chaikin Money Flow (CMF): The CMF has been negative, reflecting selling pressure in the stock.
Key Observations:
- The stock is currently in a strong bullish trend based on moving averages and MACD.
- Momentum indicators like RSI suggest an overbought condition, which might lead to a potential pullback or consolidation.
- Volatility is low, as indicated by the narrowing Bollinger Bands, signaling a period of price stability.
- Volume indicators show mixed signals, with OBV slightly increasing but CMF indicating selling pressure.
Conclusion:
Based on the analysis of the technical indicators, the stock is likely to experience a short-term pullback or consolidation due to the overbought conditions indicated by momentum indicators like RSI. However, the overall trend remains bullish, supported by moving averages and MACD. Investors should exercise caution and consider waiting for a better entry point before initiating new positions.