Technical Analysis of DGT 2024-05-10
Overview:
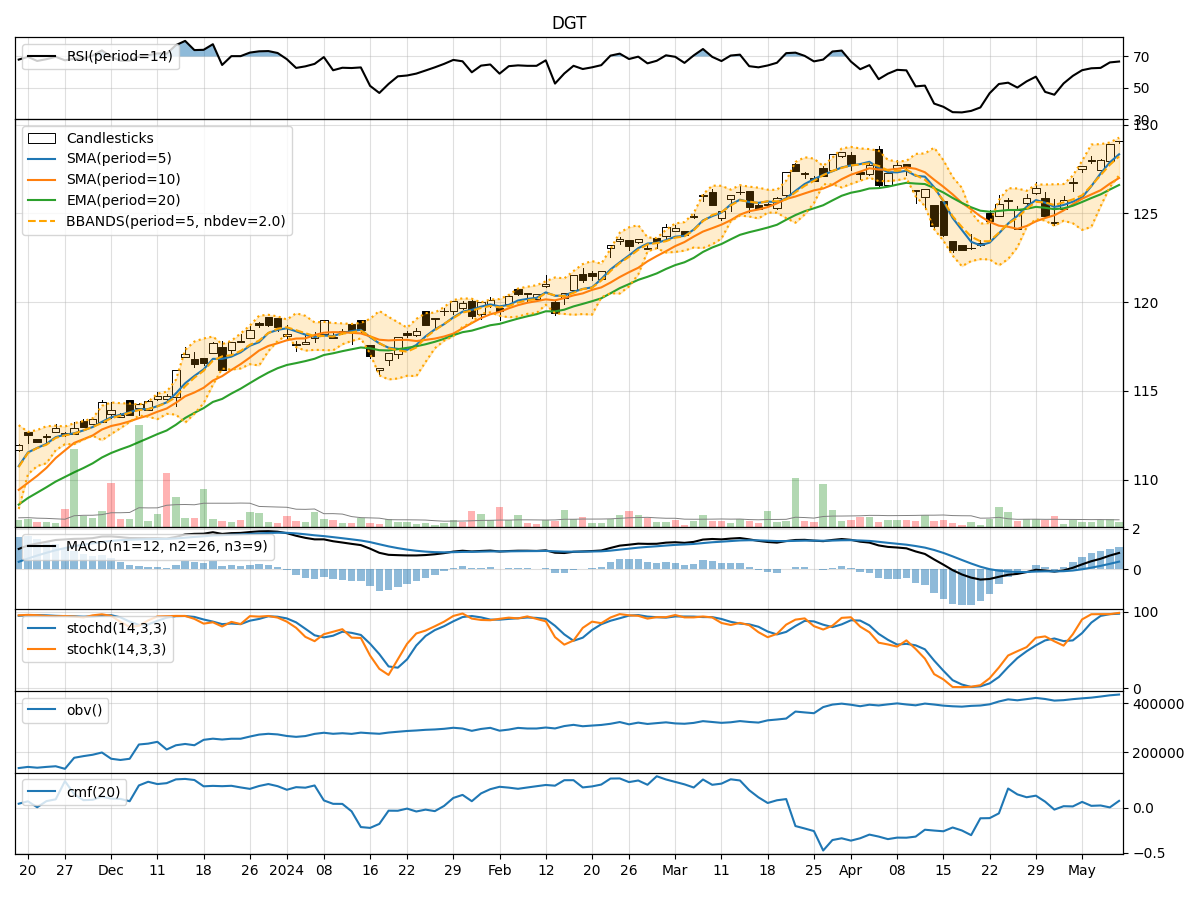
In analyzing the technical indicators for the stock represented by the ticker DGT over the last 5 days, we will delve into the trends, momentum, volatility, and volume indicators to provide insights into the possible future stock price movements. By examining these key indicators, we aim to offer a comprehensive analysis and make informed predictions for the upcoming trading days.
Trend Indicators:
- Moving Averages (MA): The moving averages have been showing a consistent uptrend over the last 5 days, with the 5-day MA consistently above the longer-term SMAs and EMAs. This indicates a positive trend in the stock price.
- MACD: The MACD line has been steadily increasing, indicating a strengthening bullish momentum in the stock.
- MACD Histogram: The MACD histogram has been consistently positive, suggesting an increasing bullish momentum.
Momentum Indicators:
- RSI: The RSI has been trending upwards, indicating increasing buying pressure and potential overbought conditions.
- Stochastic Oscillator: Both %K and %D lines of the Stochastic Oscillator have been in the overbought zone, suggesting a strong bullish momentum.
- Williams %R: The Williams %R has been hovering around the oversold territory, indicating a potential reversal in the stock price.
Volatility Indicators:
- Bollinger Bands: The Bollinger Bands have been narrowing, indicating decreasing volatility in the stock price.
- Bollinger %B: The %B indicator has been hovering around 0.8, suggesting the stock is trading near the upper band.
- Bollinger Band Width: The Band Width has been decreasing, indicating a potential decrease in volatility.
Volume Indicators:
- On-Balance Volume (OBV): The OBV has been steadily increasing, indicating strong buying volume in the stock.
- Chaikin Money Flow (CMF): The CMF has been positive, suggesting that money is flowing into the stock.
Key Observations:
- The stock is currently in an upward trend based on moving averages and MACD indicators.
- Momentum indicators like RSI and Stochastic Oscillator suggest the stock is in overbought territory, indicating a potential pullback.
- Volatility indicators show a decreasing volatility, which may lead to a period of consolidation.
- Strong buying volume indicated by OBV and positive CMF supports the bullish outlook.
Conclusion:
Based on the analysis of the technical indicators, the next few days for the stock DGT are likely to see a consolidation phase with a potential pullback due to overbought conditions indicated by momentum indicators. However, the overall trend remains bullish supported by strong buying volume. Traders should be cautious of a possible short-term correction before the stock potentially resumes its upward trajectory.