Technical Analysis of DIEM 2024-05-10
Overview:
In analyzing the technical indicators for DIEM stock over the last 5 days, we will delve into the trend, momentum, volatility, and volume indicators to provide a comprehensive outlook on the possible stock price movement in the coming days. By examining these key indicators, we aim to offer valuable insights and predictions for potential investors.
Trend Indicators:
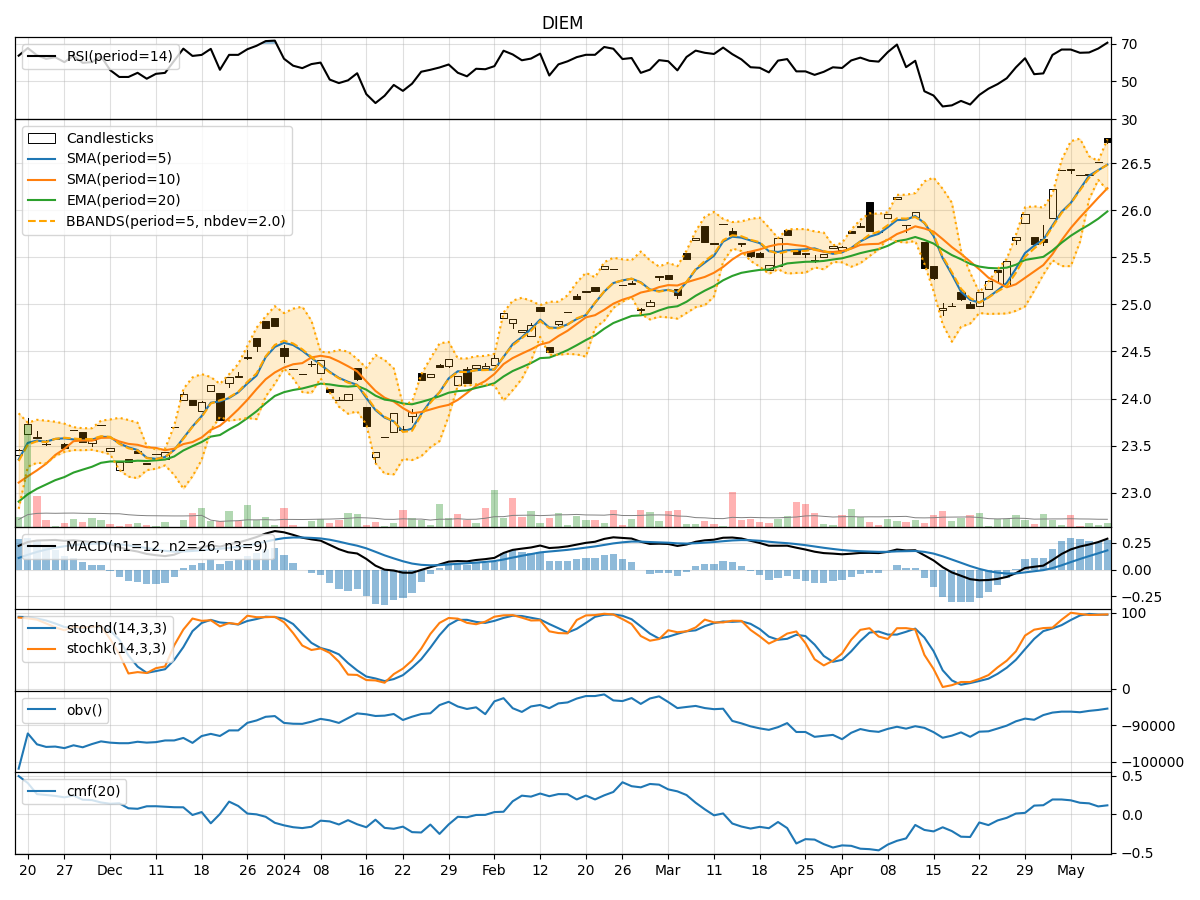
- Moving Averages (MA): The 5-day Moving Average has been consistently above the Simple Moving Average (SMA) and Exponential Moving Average (EMA), indicating a bullish trend.
- MACD: The MACD line has been above the signal line for the past 5 days, with both lines showing an upward trend, suggesting bullish momentum.
- MACD Histogram: The MACD Histogram has been increasing over the last 5 days, indicating strengthening bullish momentum.
Momentum Indicators:
- RSI: The Relative Strength Index (RSI) has been trending upwards and is currently in the overbought territory, suggesting a strong bullish momentum.
- Stochastic Oscillator: Both %K and %D lines of the Stochastic Oscillator have been consistently high, indicating strong buying pressure.
- Williams %R: The Williams %R is in the oversold region, suggesting a potential reversal in the short term.
Volatility Indicators:
- Bollinger Bands: The stock price has been trading within the Bollinger Bands, with the bands widening slightly, indicating increased volatility.
- Bollinger %B: The %B indicator is above 0.5, suggesting that the stock price is trading above the mid-band, indicating a bullish sentiment.
Volume Indicators:
- On-Balance Volume (OBV): The OBV has been increasing over the last 5 days, indicating strong buying volume.
- Chaikin Money Flow (CMF): The CMF has been positive, indicating that money is flowing into the stock.
Conclusion:
Based on the analysis of the technical indicators, the overall outlook for DIEM stock is bullish in the short term. The trend indicators, momentum indicators, and volume indicators all point towards a continuation of the current bullish trend. The volatility indicators suggest that there might be some short-term fluctuations due to increased volatility, but the overall trend remains positive.
Therefore, it is likely that DIEM stock will experience further upward movement in the next few days. Investors may consider taking advantage of the current bullish momentum and consider entering long positions to capitalize on potential price appreciation. However, it is essential to monitor the indicators closely for any signs of reversal or weakening bullish momentum.