Technical Analysis of DIHP 2024-05-10
Overview:
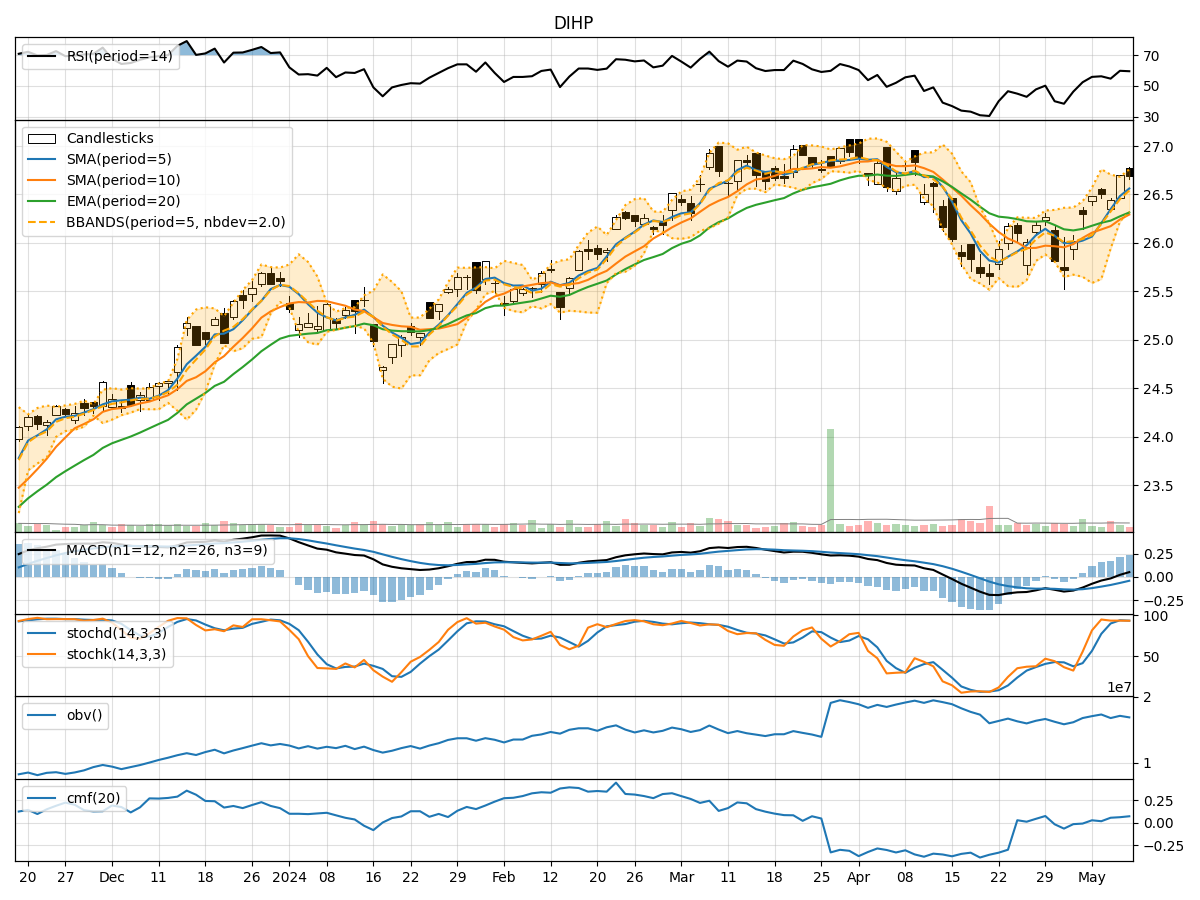
In analyzing the technical indicators for DIHP over the last 5 days, we will delve into the trend, momentum, volatility, and volume indicators to provide a comprehensive outlook on the possible stock price movement in the coming days. By examining these key indicators, we aim to offer valuable insights and predictions for informed decision-making.
Trend Analysis:
- Moving Averages (MA): The 5-day MA has been consistently above the closing prices, indicating a short-term uptrend.
- MACD: The MACD line has been positive, suggesting bullish momentum.
- EMA: The EMA has been trending slightly upwards, supporting the bullish sentiment.
Momentum Analysis:
- RSI: The RSI has been fluctuating around the neutral zone, indicating indecision in the market.
- Stochastic Oscillator: Both %K and %D have been in overbought territory, signaling a potential reversal.
- Williams %R: The indicator has been hovering near oversold levels, suggesting a possible buying opportunity.
Volatility Analysis:
- Bollinger Bands: The price has been trading within the bands, indicating normal volatility.
- Bollinger %B: The %B indicator has been fluctuating around the midline, reflecting a balanced market sentiment.
Volume Analysis:
- On-Balance Volume (OBV): The OBV has shown mixed signals, reflecting uncertainty in the accumulation/distribution of the stock.
- Chaikin Money Flow (CMF): The CMF has been positive, indicating buying pressure in the market.
Key Observations:
- The trend indicators suggest a bullish bias in the short term.
- Momentum indicators show conflicting signals, with RSI indicating neutrality and stochastic oscillators hinting at a potential reversal.
- Volatility remains stable, with no significant spikes or drops.
- Volume indicators reflect mixed signals, with OBV showing uncertainty and CMF indicating buying pressure.
Conclusion:
Based on the analysis of the technical indicators, the stock price of DIHP is likely to experience further upward movement in the coming days. The bullish trend supported by moving averages and MACD, despite some conflicting signals from momentum indicators, suggests a positive outlook. Volatility is expected to remain stable, and the buying pressure indicated by CMF could drive prices higher. Traders and investors may consider buying opportunities in DIHP based on the current technical analysis.