Technical Analysis of DIM 2024-05-10
Overview:
In analyzing the technical indicators for the stock with the ticker symbol DIM over the last 5 days, we will delve into the trends, momentum, volatility, and volume indicators to provide a comprehensive outlook on the possible stock price movement in the upcoming days.
Trend Indicators:
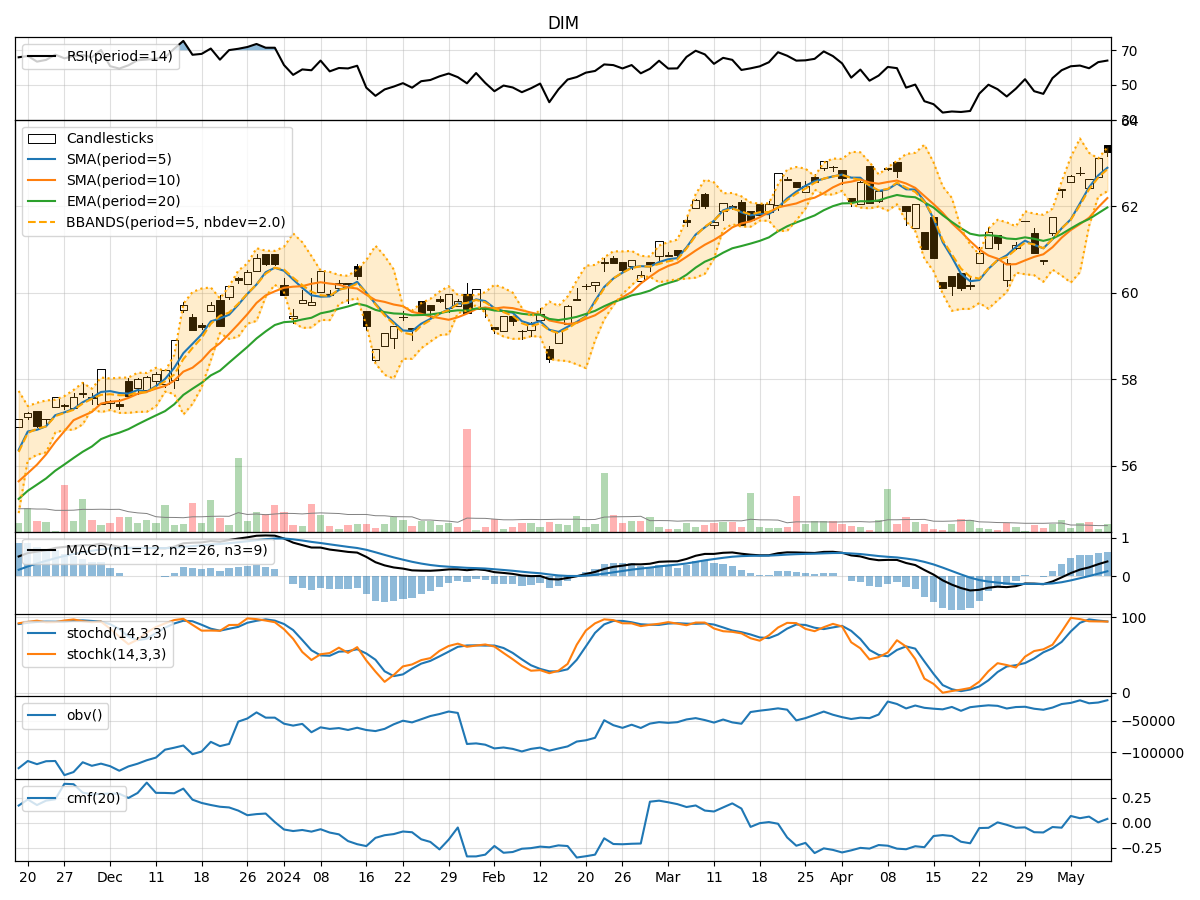
- Moving Averages (MA): The 5-day Moving Average (MA) has been consistently rising, indicating a bullish trend in the short term.
- MACD: The Moving Average Convergence Divergence (MACD) has been positive and increasing, suggesting upward momentum.
- EMA: The Exponential Moving Average (EMA) has also been trending upwards, supporting the bullish sentiment.
Momentum Indicators:
- RSI: The Relative Strength Index (RSI) has been in the overbought territory, indicating a strong bullish momentum.
- Stochastic Oscillator: Both %K and %D have been high, signaling a potential overbought condition.
- Williams %R: The Williams %R is also in the oversold region, further supporting the bullish momentum.
Volatility Indicators:
- Bollinger Bands (BB): The Bollinger Bands have been relatively narrow, suggesting low volatility in the stock price.
- BB% (Bollinger Band %B): The %B indicator has been hovering around the middle, indicating a balanced market sentiment.
Volume Indicators:
- On-Balance Volume (OBV): The OBV has shown a slight increase, reflecting positive volume flow.
- Chaikin Money Flow (CMF): The CMF has been positive but relatively flat, indicating a neutral volume trend.
Key Observations:
- The stock has exhibited a strong bullish trend based on moving averages and MACD.
- Momentum indicators suggest an overbought condition, potentially signaling a need for a price correction.
- Volatility has been low, indicating a stable price movement.
- Volume indicators show a slight increase in buying pressure but with a neutral volume trend overall.
Conclusion:
Based on the analysis of the technical indicators, the stock of DIM is currently in an overbought state with a strong bullish trend. However, considering the high RSI and Stochastic values, there might be a potential for a price correction in the near future. The low volatility and neutral volume trend suggest that the stock may enter a consolidation phase before resuming its upward movement. Traders should exercise caution and consider taking profits or implementing risk management strategies in anticipation of a possible price pullback.