Technical Analysis of DIP 2024-05-10
Overview:
In analyzing the provided technical indicators for the last 5 days, we will delve into the trend, momentum, volatility, and volume indicators to gain a comprehensive understanding of the stock's potential price movement. By examining these key aspects, we aim to provide valuable insights and predictions for the next few days.
Trend Analysis:
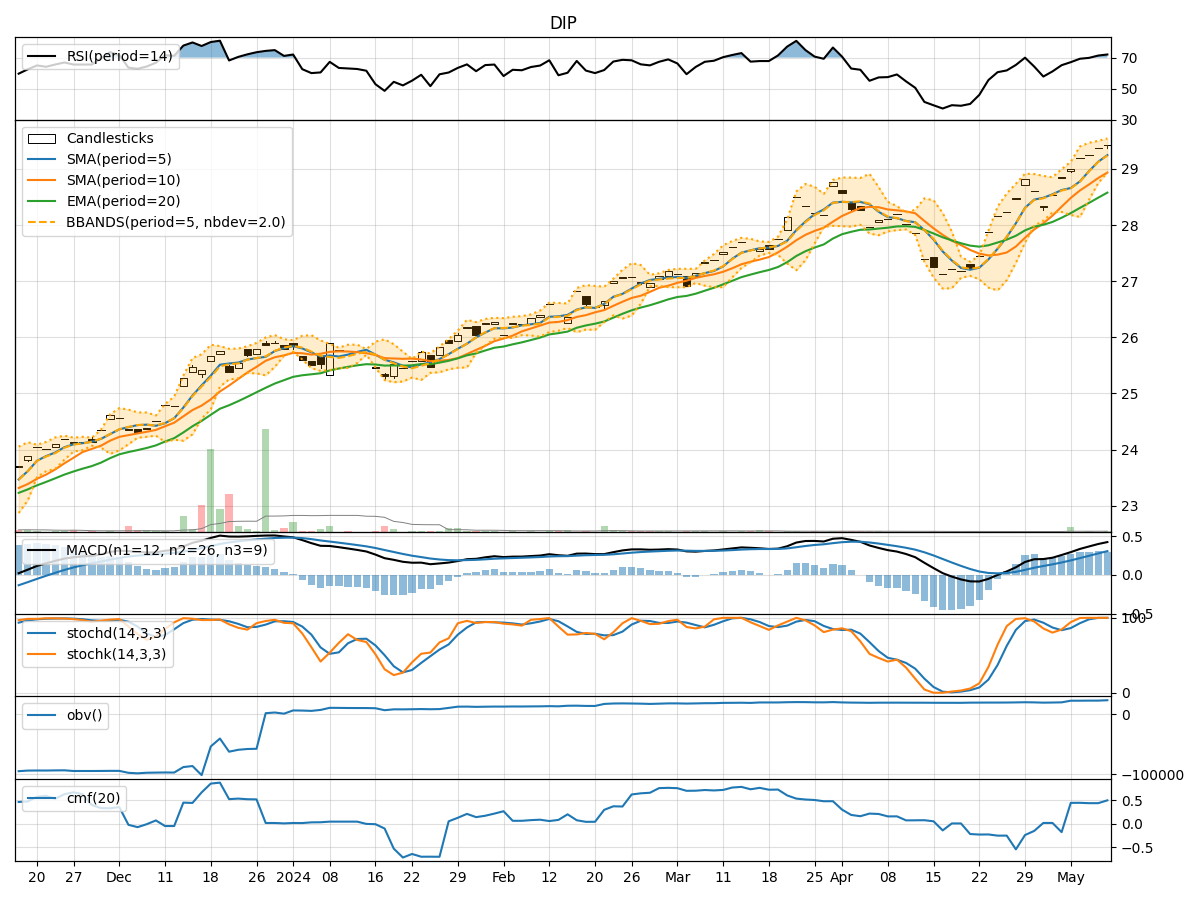
- Moving Averages (MA): The 5-day Moving Average (MA) has been consistently above the Simple Moving Average (SMA) and Exponential Moving Average (EMA), indicating a bullish trend.
- MACD: The MACD line has been above the signal line, with both lines showing an upward trend, suggesting bullish momentum.
- RSI: The Relative Strength Index (RSI) has been steadily increasing and is in the overbought territory, signaling a strong bullish momentum.
Momentum Analysis:
- Stochastic Oscillator: Both %K and %D have been at 100%, indicating strong bullish momentum.
- Williams %R: The Williams %R is at 0.0, signaling an overbought condition and potential for a reversal.
Volatility Analysis:
- Bollinger Bands (BB): The stock price has been consistently trading above the middle Bollinger Band (BBM), indicating an upward trend with low volatility.
- BB% (BB Percentage): The BB% has been relatively stable around 0.8, suggesting a moderate level of volatility.
Volume Analysis:
- On-Balance Volume (OBV): The OBV has been steadily increasing, indicating strong buying pressure.
- Chaikin Money Flow (CMF): The CMF has been positive and increasing, reflecting bullish accumulation.
Conclusion:
Based on the analysis of the technical indicators, the stock is exhibiting strong bullish signals across trend, momentum, volatility, and volume indicators. The moving averages, MACD, RSI, Stochastic Oscillator, OBV, and CMF all point towards continued upward momentum in the stock price. The low volatility and consistent buying pressure further support the bullish outlook.
Prediction:
Given the current technical indicators and market dynamics, the next few days are likely to see the stock price continue its upward trajectory. Traders and investors may consider buying opportunities to capitalize on the bullish momentum. It is essential to monitor the indicators closely for any signs of potential reversal or consolidation in the future.