Technical Analysis of DISO 2024-05-10
Overview:
In analyzing the technical indicators for DISO over the last 5 days, we will delve into the trend, momentum, volatility, and volume indicators to provide a comprehensive outlook on the possible stock price movement in the coming days.
Trend Analysis:
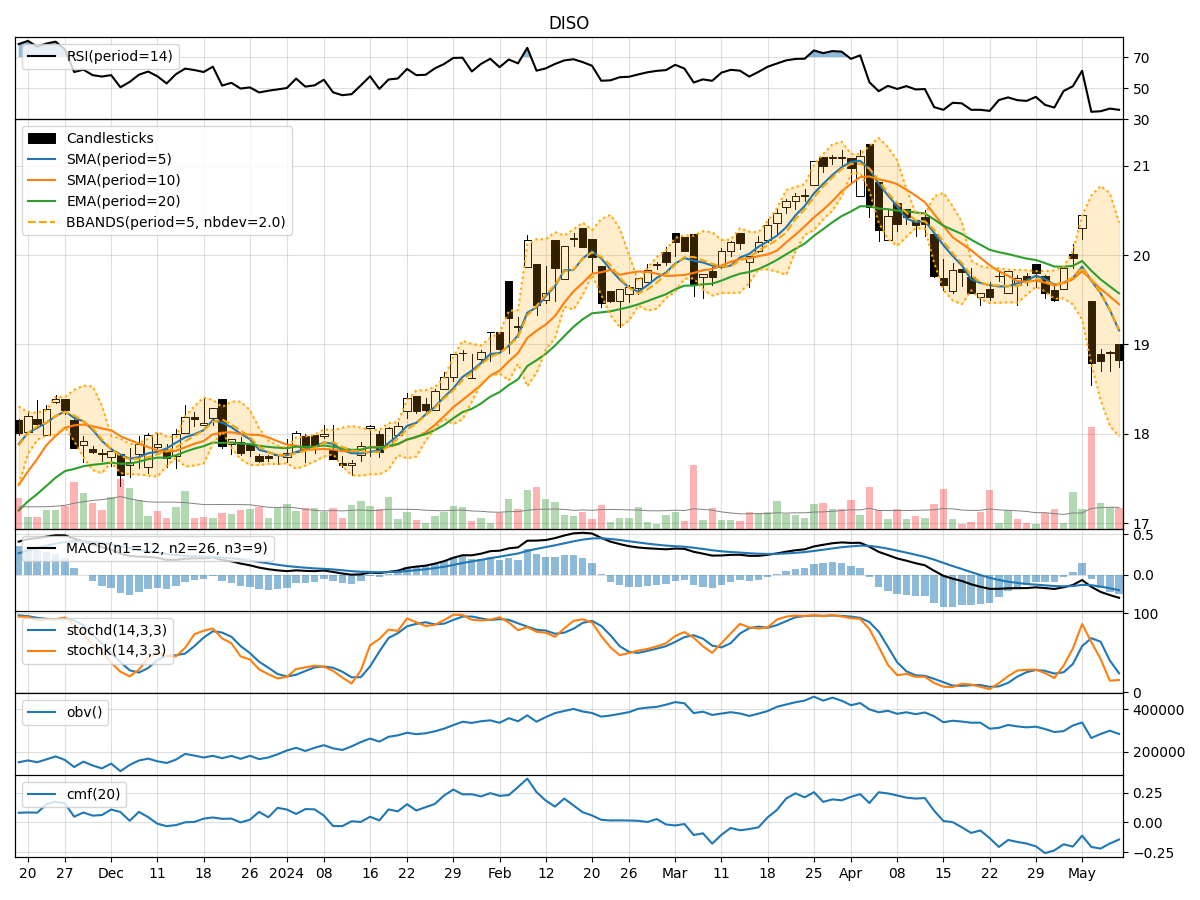
- Moving Averages (MA): The 5-day Moving Average (MA) has been consistently below the Simple Moving Average (SMA) and Exponential Moving Average (EMA), indicating a downward trend.
- MACD: The MACD line has been negative, with the MACD Histogram also showing a downward trend, suggesting bearish momentum.
Momentum Analysis:
- RSI: The Relative Strength Index (RSI) has been fluctuating around the 30-70 range, indicating a lack of strong momentum in either direction.
- Stochastic Oscillator: Both %K and %D have been in oversold territory, suggesting a potential reversal or consolidation phase.
Volatility Analysis:
- Bollinger Bands (BB): The stock price has been trading below the lower Bollinger Band, indicating oversold conditions and potential for a reversal.
- Bollinger Band Width (BBW): The Bollinger Band Width has been narrowing, suggesting decreasing volatility.
Volume Analysis:
- On-Balance Volume (OBV): The OBV has been declining, indicating selling pressure and a bearish sentiment.
- Chaikin Money Flow (CMF): The CMF has been negative, reflecting outflow of money from the stock.
Key Observations and Opinions:
- Trend: The trend indicators suggest a bearish outlook with the stock price consistently below key moving averages.
- Momentum: The momentum indicators show a lack of strong momentum in either direction, indicating a possible consolidation phase.
- Volatility: Volatility has been decreasing, potentially signaling a period of stabilization in the stock price.
- Volume: The declining OBV and negative CMF point towards bearish sentiment and selling pressure.
Conclusion:
Based on the analysis of the technical indicators, the stock price of DISO is likely to continue its downward movement in the next few days. The bearish trend, lack of strong momentum, decreasing volatility, and negative volume indicators all point towards a continued bearish sentiment in the market. Traders and investors should exercise caution and consider short-term selling strategies or staying on the sidelines until a clearer trend reversal signal emerges.