Technical Analysis of DISV 2024-05-10
Overview:
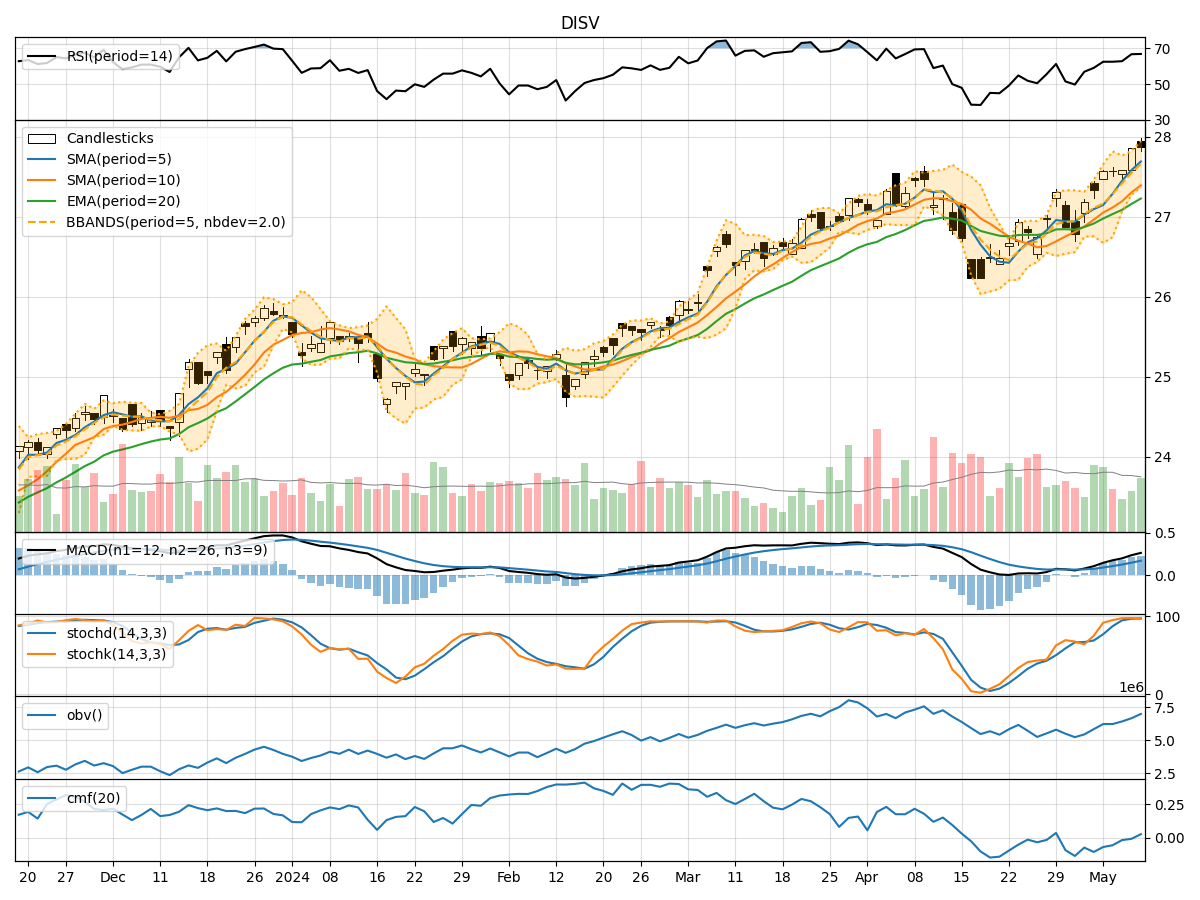
In analyzing the technical indicators for DISV over the last 5 days, we will delve into the trend, momentum, volatility, and volume indicators to provide a comprehensive outlook on the possible stock price movement in the coming days. By examining these key aspects, we aim to offer valuable insights and predictions for potential investors.
Trend Indicators:
- Moving Averages (MA): The 5-day MA has been consistently above the closing prices, indicating a bullish trend.
- MACD: The MACD line has been above the signal line, suggesting a positive momentum in the stock price.
- EMA: The EMA has been steadily increasing, reflecting a bullish sentiment in the market.
Momentum Indicators:
- RSI: The RSI has been in the range of 60-70, indicating a neutral to slightly bullish momentum.
- Stochastic Oscillator: Both %K and %D have been in the overbought territory, signaling a potential reversal or consolidation.
- Williams %R: The Williams %R has been fluctuating around the oversold region, suggesting a mixed sentiment.
Volatility Indicators:
- Bollinger Bands (BB): The stock price has been trading within the bands, indicating a stable price movement.
- BB Width: The width of the bands has been relatively narrow, suggesting low volatility in the stock.
- BB %B: The %B indicator has been hovering around the midline, reflecting a balanced market sentiment.
Volume Indicators:
- On-Balance Volume (OBV): The OBV has shown a slight increase, indicating some buying pressure in the stock.
- Chaikin Money Flow (CMF): The CMF has been negative, suggesting a net outflow of money from the stock.
Key Observations:
- The trend indicators point towards a bullish sentiment in the stock price.
- Momentum indicators show a mixed sentiment with potential signs of overbought conditions.
- Volatility indicators suggest a stable price movement with low volatility.
- Volume indicators indicate a slight increase in buying pressure but overall negative money flow.
Conclusion:
Based on the analysis of the technical indicators, the stock price of DISV is likely to experience further upward movement in the coming days. However, caution is advised as some momentum indicators are showing signs of potential reversal or consolidation. Investors should closely monitor the price action and key support/resistance levels to make informed trading decisions.