Technical Analysis of DIVB 2024-05-10
Overview:
In analyzing the technical indicators for DIVB over the last 5 days, we will delve into the trend, momentum, volatility, and volume indicators to provide a comprehensive outlook on the possible stock price movement in the coming days. By examining these key indicators, we aim to offer valuable insights and predictions for informed decision-making.
Trend Indicators:
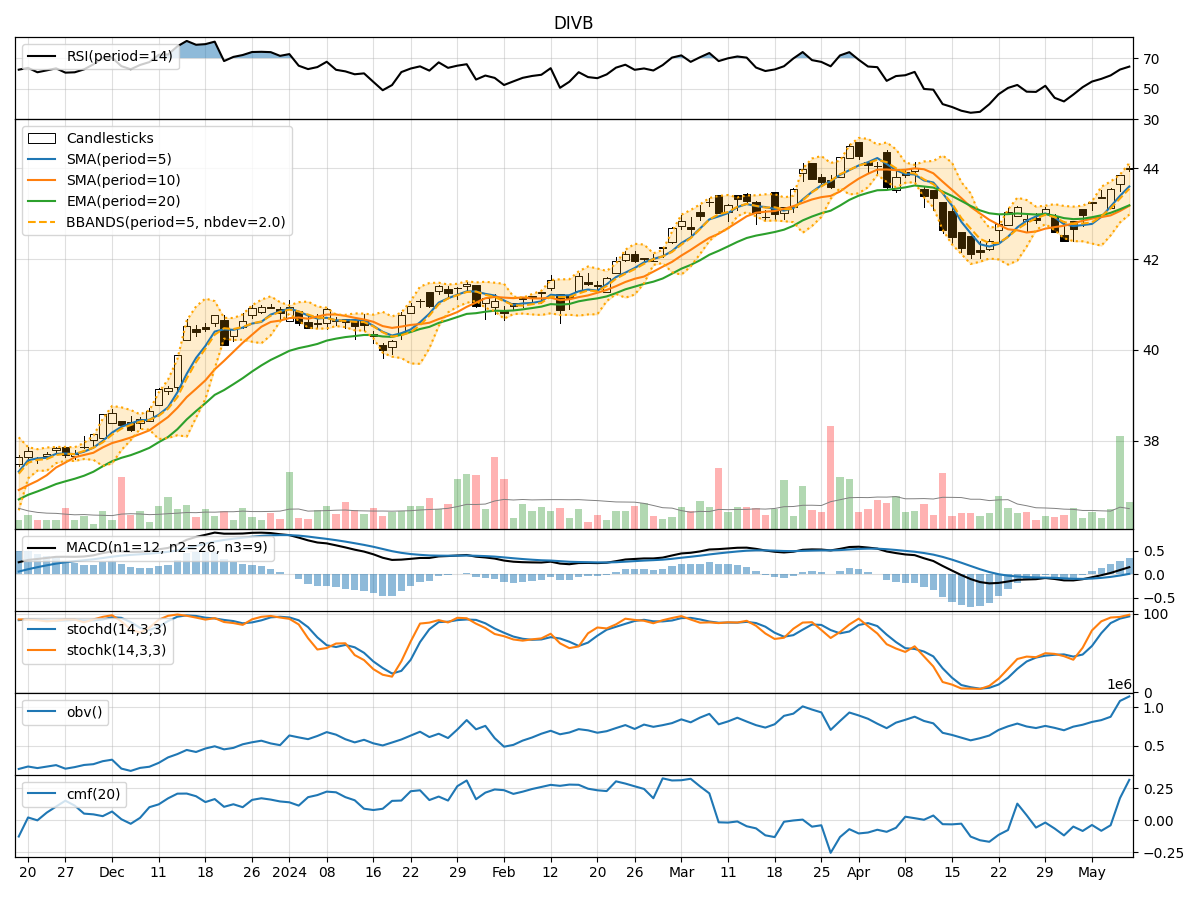
- Moving Averages (MA): The 5-day moving average has been consistently above the simple moving average (SMA) and exponential moving average (EMA), indicating a short-term uptrend.
- MACD: The MACD line has been consistently above the signal line, with both lines showing an upward trend, suggesting bullish momentum.
- MACD Histogram: The histogram has been increasing over the past 5 days, indicating strengthening bullish momentum.
Momentum Indicators:
- RSI: The Relative Strength Index (RSI) has been trending upwards and is currently in the overbought territory, suggesting a strong bullish momentum.
- Stochastic Oscillator: Both %K and %D lines of the Stochastic Oscillator are in the overbought zone, indicating a potential reversal or consolidation.
- Williams %R: The Williams %R is in the oversold region, signaling a potential reversal to the upside.
Volatility Indicators:
- Bollinger Bands: The stock price has been trading near the upper Bollinger Band, indicating high volatility and a potential overbought condition.
- Bollinger Band Width: The Band Width has been narrowing, suggesting a decrease in volatility and a possible period of consolidation.
- Bollinger Band %B: The %B indicator is above 0.8, indicating that the stock price is trading at the upper end of its recent range.
Volume Indicators:
- On-Balance Volume (OBV): The OBV has been trending upwards, indicating accumulation by investors.
- Chaikin Money Flow (CMF): The CMF has been positive over the last 5 days, suggesting buying pressure in the stock.
Conclusion:
Based on the analysis of the technical indicators, the stock of DIVB is currently exhibiting strong bullish momentum, as indicated by the uptrend in moving averages, MACD signals, RSI in the overbought zone, and positive OBV and CMF. However, the Stochastic Oscillator being in the overbought region and the narrowing Bollinger Band Width suggest a potential consolidation or minor pullback in the near term.
Forecast:
Given the overall bullish sentiment in the market, the stock price of DIVB is likely to continue its upward trajectory in the short term. Traders should watch for potential profit-taking near overbought levels and monitor for any signs of reversal indicated by the Stochastic Oscillator. Long-term investors can consider holding their positions with a target price of $45.00 in the next few trading days.
Key Recommendations:
- Short-Term: Consider booking partial profits near overbought levels and wait for a potential dip to re-enter.
- Long-Term: Hold positions with a target price of $45.00, considering the strong bullish momentum and positive volume indicators.
Disclaimer:
This analysis is based solely on technical indicators and historical price data. It is essential to conduct thorough research and consider other fundamental factors before making any investment decisions. Consulting with a financial advisor is recommended to align investments with individual financial goals and risk tolerance levels.