Technical Analysis of DIVD 2024-05-10
Overview:
In analyzing the technical indicators for DIVD stock over the last 5 days, we will delve into the trend, momentum, volatility, and volume indicators to provide a comprehensive outlook on the possible stock price movement in the coming days. By examining these key indicators, we aim to offer valuable insights and recommendations for potential investors.
Trend Analysis:
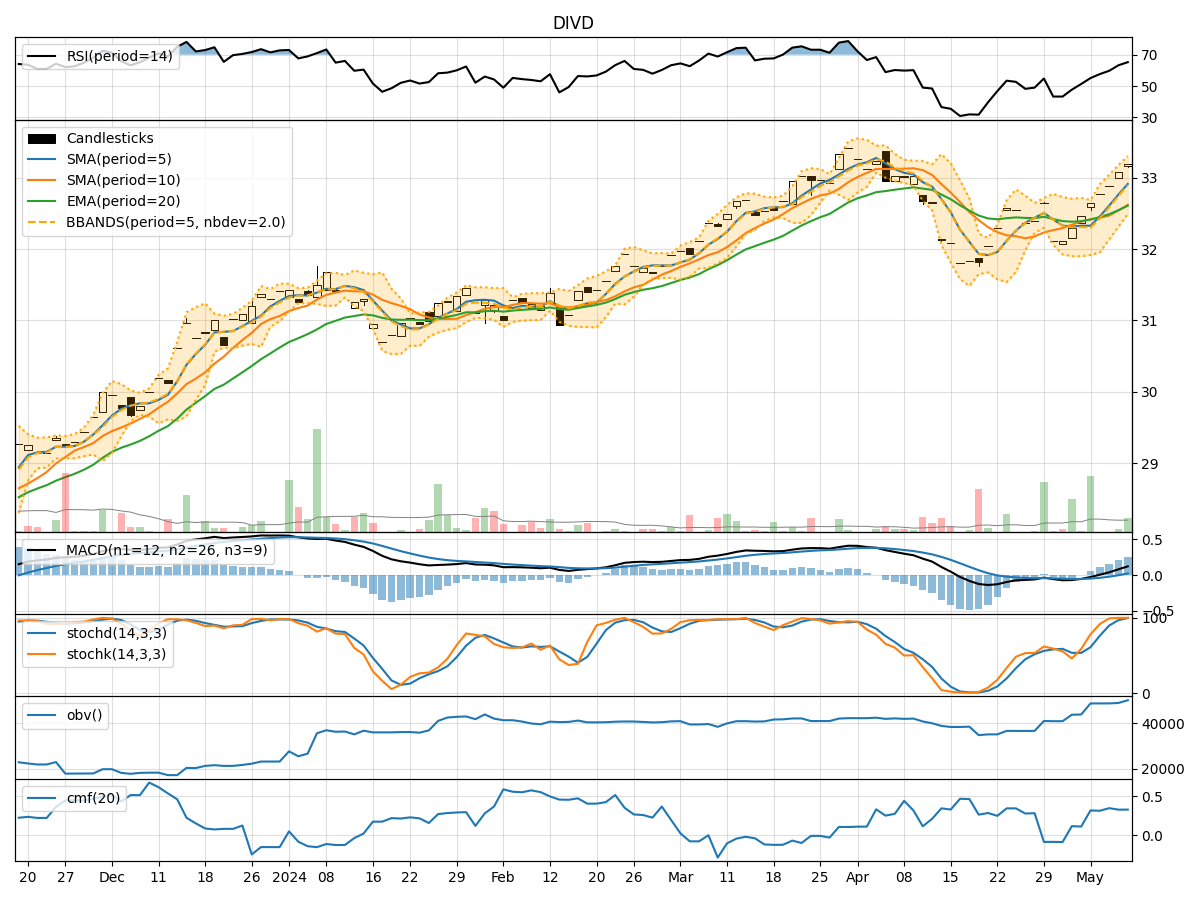
- Moving Averages (MA): The 5-day Moving Average (MA) has been consistently above the Simple Moving Average (SMA) and Exponential Moving Average (EMA), indicating a bullish trend.
- MACD: The MACD line has been consistently above the signal line, with both lines showing an upward trend, suggesting bullish momentum.
Momentum Analysis:
- RSI: The Relative Strength Index (RSI) has been increasing and is currently in the overbought territory, indicating strong buying momentum.
- Stochastic Oscillator: Both %K and %D have been at or near 100, signaling strong bullish momentum.
Volatility Analysis:
- Bollinger Bands (BB): The stock price has been consistently trading above the middle Bollinger Band (BBM), indicating an upward trend with low volatility.
Volume Analysis:
- On-Balance Volume (OBV): The OBV has been increasing over the last 5 days, suggesting accumulation by investors.
- Chaikin Money Flow (CMF): The CMF has been positive, indicating buying pressure in the stock.
Key Observations:
- The stock is currently in a strong bullish trend based on moving averages and MACD.
- Momentum indicators like RSI and Stochastic Oscillator suggest strong buying momentum.
- Volatility is relatively low, as indicated by the Bollinger Bands, which could signify a period of consolidation.
- Volume indicators show increasing accumulation and buying pressure in the stock.
Conclusion:
Based on the analysis of the technical indicators, the stock is likely to continue its upward movement in the coming days. The strong bullish trend, coupled with robust momentum and positive volume indicators, supports a bullish view on the stock. Traders and investors may consider buying opportunities in anticipation of further price appreciation. It is essential to monitor the indicators closely for any signs of reversal or increased volatility.