Technical Analysis of DIVI 2024-05-10
Overview:
In analyzing the technical indicators for DIVI stock over the last 5 days, we will delve into the trend, momentum, volatility, and volume indicators to provide a comprehensive outlook on the possible stock price movement in the coming days. By examining these key indicators, we aim to offer valuable insights and predictions for investors looking to make informed decisions.
Trend Analysis:
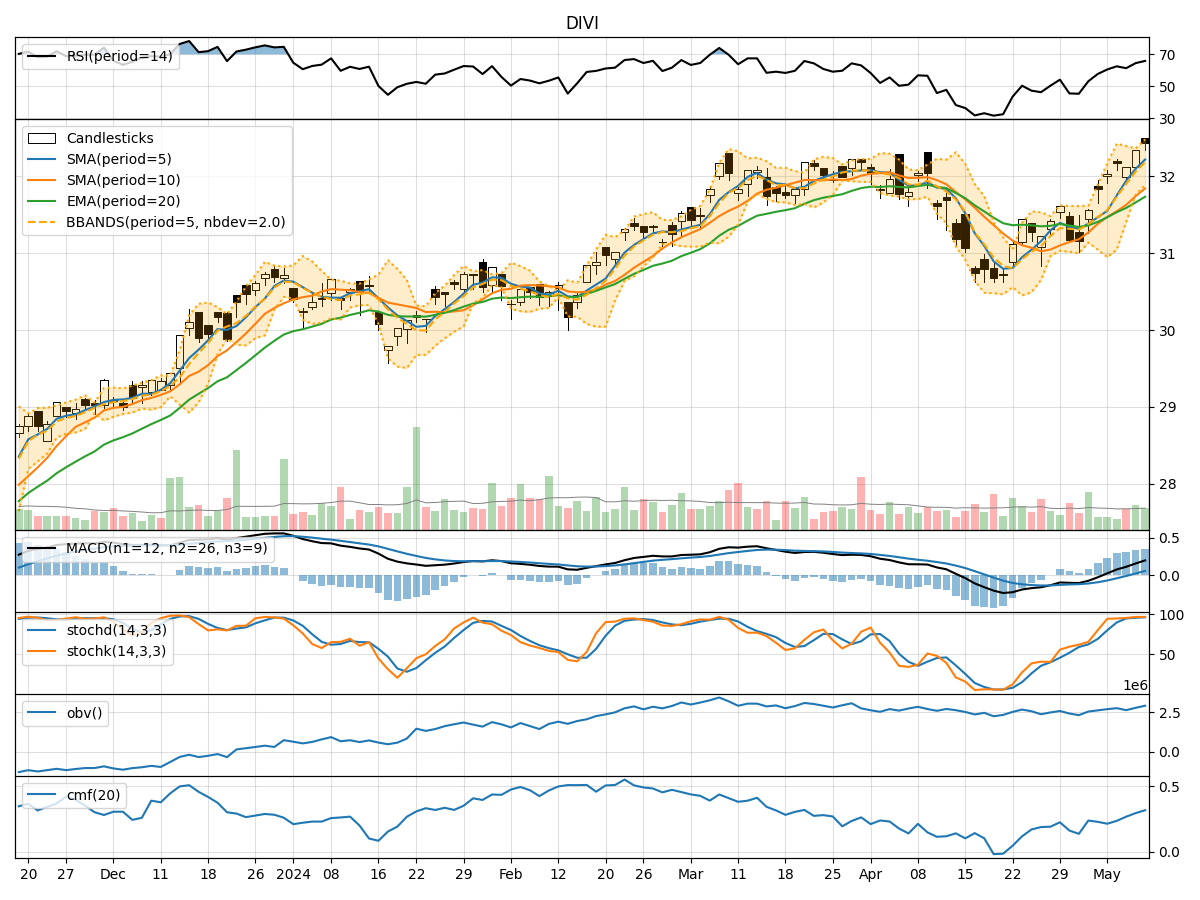
- Moving Averages (MA): The 5-day Moving Average (MA) has been consistently trending upwards, indicating a positive momentum in the stock price.
- MACD: The MACD line has been increasing steadily, with the MACD histogram also showing an upward trend, suggesting bullish momentum.
- Relative Strength Index (RSI): The RSI has been in the overbought territory, indicating a strong bullish sentiment in the market.
Momentum Analysis:
- Stochastic Oscillator: Both %K and %D lines of the Stochastic Oscillator are in the overbought zone, signaling a potential reversal or consolidation in the stock price.
- Williams %R (WillR): The Williams %R is also in the oversold region, further supporting the possibility of a price correction.
Volatility Analysis:
- Bollinger Bands (BB): The Bollinger Bands have been narrowing, suggesting a decrease in volatility and a potential period of consolidation in the stock price.
- Bollinger Band %B (BBP): The %B indicator is hovering around 0.8, indicating that the stock price is trading near the upper band, which could lead to a pullback.
Volume Analysis:
- On-Balance Volume (OBV): The OBV indicator has been steadily increasing, reflecting strong buying pressure in the stock.
- Chaikin Money Flow (CMF): The CMF is also positive, indicating that money is flowing into the stock.
Conclusion:
Based on the analysis of the technical indicators, the next few days' possible stock price movement for DIVI appears to be consolidation or a slight pullback. The stock has shown signs of being overbought, with indicators like the Stochastic Oscillator and Williams %R suggesting a potential reversal. Additionally, the narrowing Bollinger Bands and high RSI levels indicate a period of consolidation may be on the horizon. Investors should exercise caution and consider taking profits or implementing risk management strategies in anticipation of a possible correction in the stock price.