Technical Analysis of DIVL 2024-05-10
Overview:
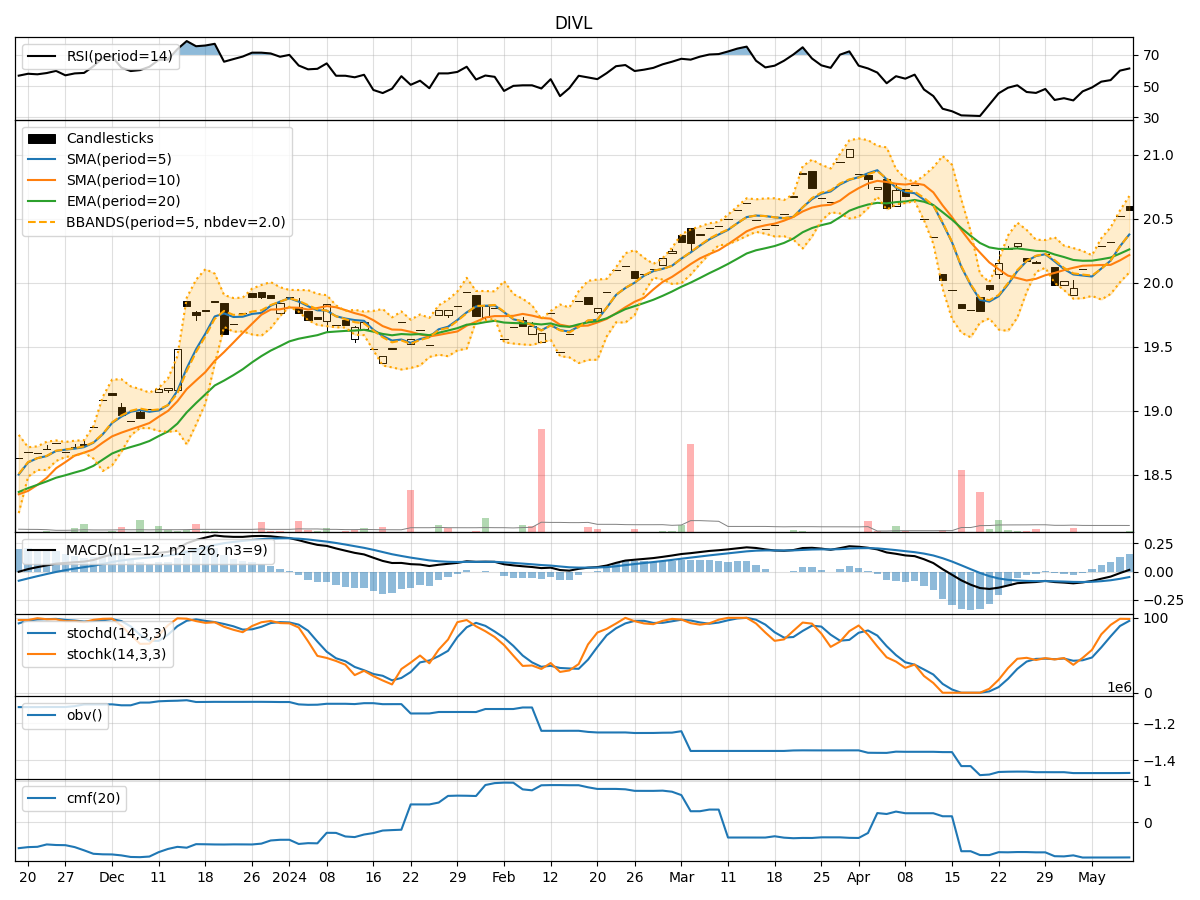
In analyzing the technical indicators for DIVL over the last 5 days, we will delve into the trend, momentum, volatility, and volume indicators to provide a comprehensive outlook on the possible stock price movement in the coming days. By examining these key indicators, we aim to offer valuable insights and predictions for informed decision-making.
Trend Indicators:
- Moving Averages (MA): The 5-day Moving Average (MA) has been trending upwards, indicating a positive momentum in the stock price.
- MACD: The Moving Average Convergence Divergence (MACD) has been consistently positive, suggesting a bullish trend.
- EMA: The Exponential Moving Average (EMA) has also been on an upward trajectory, supporting the bullish sentiment in the short term.
Momentum Indicators:
- RSI: The Relative Strength Index (RSI) has been increasing, showing strengthening momentum in the stock.
- Stochastic Oscillator: Both %K and %D of the Stochastic Oscillator are in the overbought region, indicating a potential reversal or consolidation.
- Williams %R: The Williams %R is in the oversold territory, suggesting a possible reversal in the short term.
Volatility Indicators:
- Bollinger Bands: The Bollinger Bands are widening, indicating increased volatility in the stock price.
- Bollinger %B: The %B indicator is fluctuating within the bands, signifying potential price reversals or breakouts.
Volume Indicators:
- On-Balance Volume (OBV): The OBV has been declining, suggesting selling pressure in the stock.
- Chaikin Money Flow (CMF): The CMF is negative, indicating a bearish sentiment in the market.
Key Observations and Opinions:
- Trend: The overall trend based on moving averages and MACD is bullish.
- Momentum: While RSI shows positive momentum, the Stochastic Oscillator and Williams %R indicate potential overbought conditions.
- Volatility: Increasing Bollinger Bands suggest higher price fluctuations ahead.
- Volume: Declining OBV and negative CMF point towards bearish volume trends.
Conclusion:
Based on the analysis of the technical indicators, the next few days' possible stock price movement for DIVL is likely to be sideways to slightly bearish. The bullish trend indicated by moving averages and MACD may face resistance due to overbought conditions highlighted by the Stochastic Oscillator and Williams %R. The increasing volatility and bearish volume indicators further support a cautious outlook. Traders should monitor key support and resistance levels for potential entry or exit points.
Disclaimer:
This analysis is based solely on technical indicators and historical data, and actual market movements may vary. It is essential to consider other factors and conduct thorough research before making any investment decisions. Consulting with a financial advisor is recommended for personalized guidance tailored to individual investment goals and risk tolerance levels.