Technical Analysis of DIVP 2024-05-10
Overview:
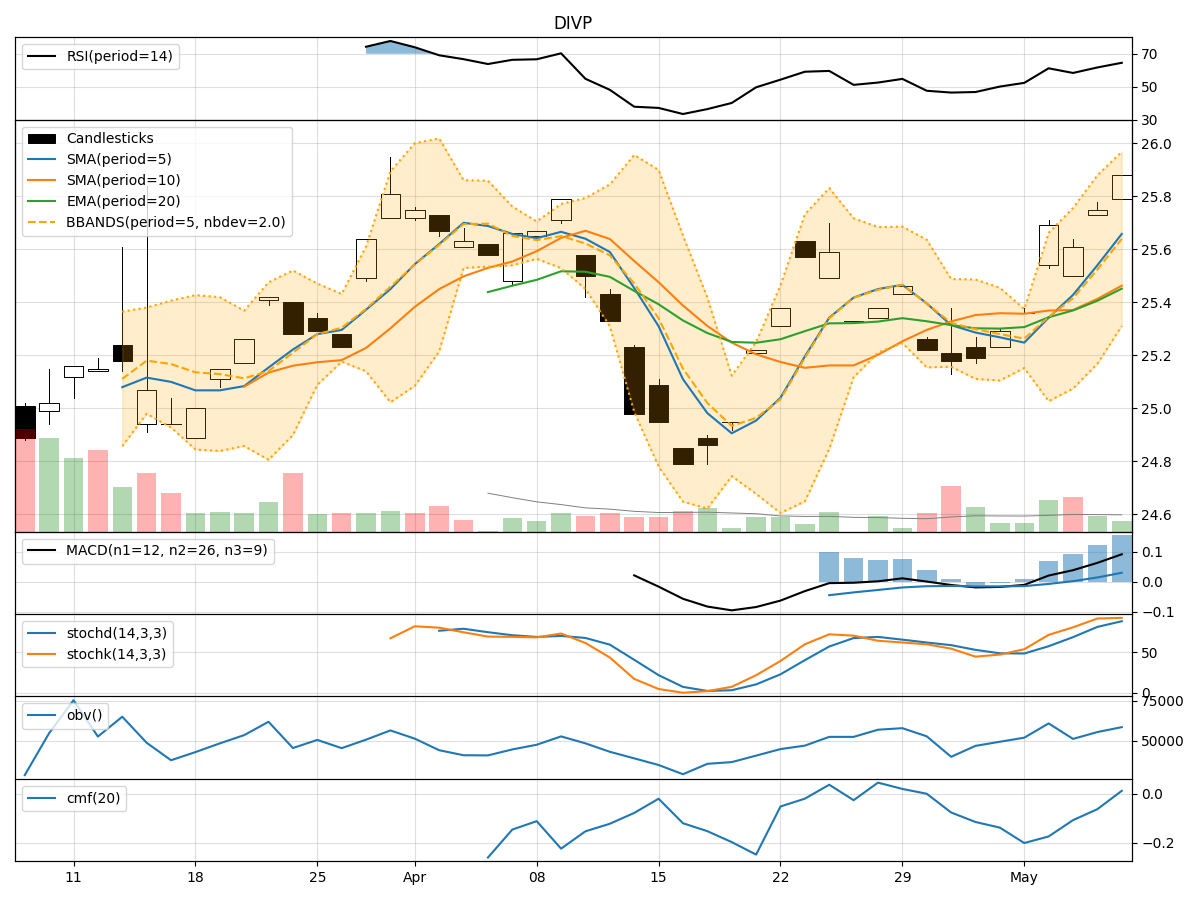
In analyzing the technical indicators for DIVP stock over the last 5 days, we will delve into the trend, momentum, volatility, and volume indicators to provide a comprehensive outlook on the possible stock price movement in the coming days. By examining these key indicators, we aim to offer valuable insights and predictions for informed decision-making.
Trend Analysis:
- Moving Averages (MA): The 5-day Moving Average (MA) has been showing an upward trend, indicating a positive momentum in the stock price.
- MACD: The Moving Average Convergence Divergence (MACD) has been consistently increasing, with the MACD line above the signal line, suggesting a bullish trend.
- EMA: The Exponential Moving Average (EMA) has been on an upward trajectory, further supporting the bullish sentiment in the stock.
Momentum Analysis:
- RSI: The Relative Strength Index (RSI) has been trending upwards, indicating increasing buying pressure and potential further upside in the stock price.
- Stochastic Oscillator: Both %K and %D lines of the Stochastic Oscillator are in the overbought zone, suggesting a strong bullish momentum.
- Williams %R: The Williams %R is close to the oversold territory, indicating a potential reversal in the stock price.
Volatility Analysis:
- Bollinger Bands: The Bollinger Bands are widening, indicating increased volatility in the stock price.
- Bollinger %B: The %B indicator is below 1, suggesting that the stock price is trading below the upper Bollinger Band, potentially signaling a buying opportunity.
- Average True Range (ATR): The ATR is relatively stable, indicating consistent price movements without significant spikes in volatility.
Volume Analysis:
- On-Balance Volume (OBV): The OBV indicator has been fluctuating, indicating mixed buying and selling pressure in the stock.
- Chaikin Money Flow (CMF): The CMF is negative, suggesting that money may be flowing out of the stock in the short term.
Conclusion:
Based on the analysis of the technical indicators, the stock of DIVP is bullish in the short term. The trend indicators, momentum oscillators, and volatility measures all point towards a potential upward movement in the stock price. However, the mixed signals from the volume indicators, particularly the negative CMF, suggest a cautious approach.
Recommendation:
Considering the overall bullish outlook, investors may consider buying DIVP stock in the short term. It is advisable to set appropriate stop-loss levels to manage risk effectively. Traders should closely monitor the price action and key support/resistance levels to capitalize on potential price movements.
Disclaimer:
This analysis is based solely on technical indicators and does not take into account fundamental factors that may impact the stock price. It is essential to conduct thorough research and consider all aspects of investing before making any financial decisions.