Technical Analysis of DIVS 2024-05-10
Overview:
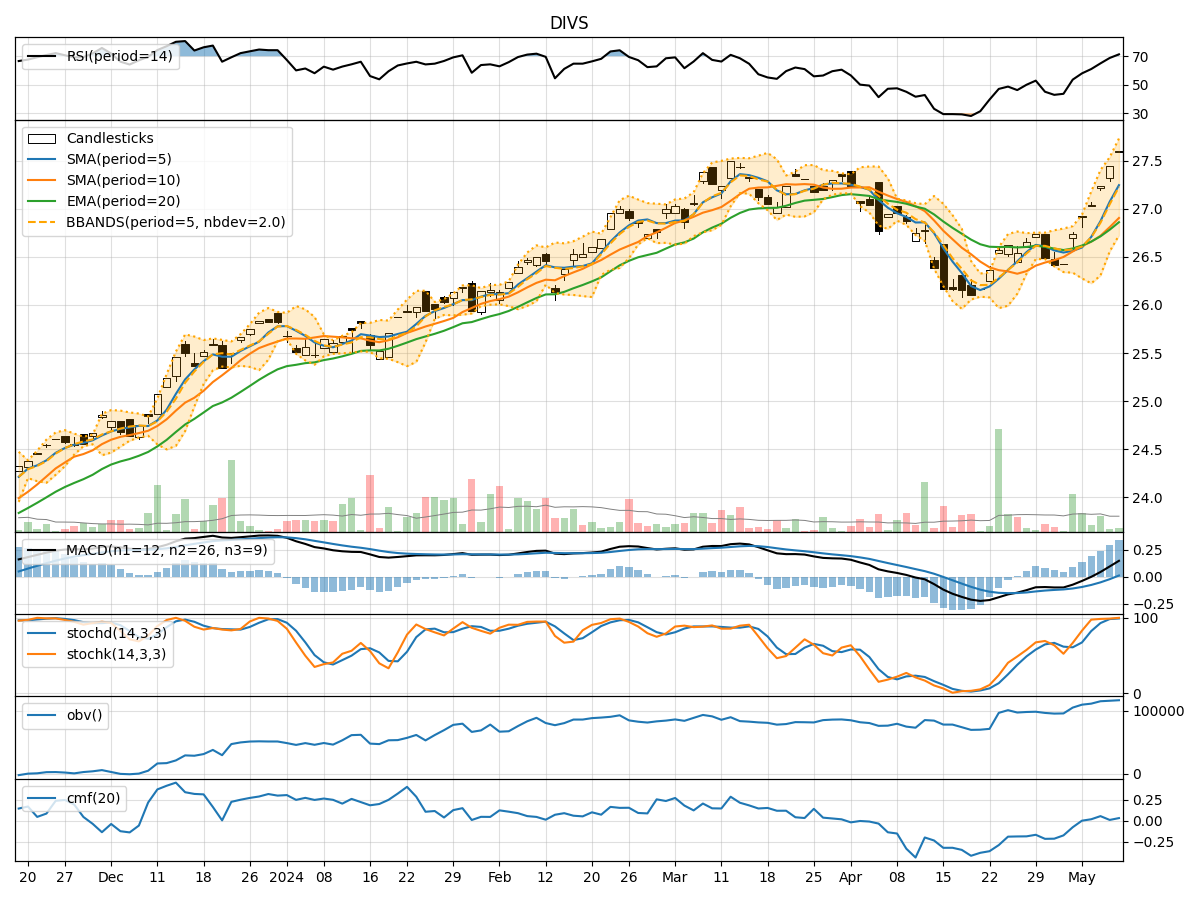
In the last 5 trading days, DIVS stock has shown a consistent uptrend in its price movement. The moving averages have been trending upwards, indicating a positive momentum. The momentum indicators such as RSI, Stochastic Oscillator, and Williams %R are all in overbought territory, suggesting a strong bullish sentiment. Volatility has been relatively stable, and volume has been increasing, supporting the upward price movement.
Trend Indicators Analysis:
- Moving Averages (MA): The 5-day MA has been consistently above the longer-term SMAs, indicating a bullish trend. The EMA has also been trending upwards, supporting the bullish momentum.
- MACD: The MACD line has been consistently above the signal line, with both lines in positive territory. The MACD histogram has been increasing, indicating strengthening bullish momentum.
Momentum Indicators Analysis:
- RSI: The RSI has been in the overbought zone, suggesting a strong buying pressure and potential for a pullback.
- Stochastic Oscillator: Both %K and %D have been in the overbought region, indicating a strong bullish momentum.
- Williams %R: The indicator has been in oversold territory, signaling a potential reversal in the short term.
Volatility Indicators Analysis:
- Bollinger Bands: The price has been trading near the upper Bollinger Band, indicating an overbought condition. However, the bands have been relatively stable, suggesting a continuation of the current trend.
- Bollinger %B: The %B indicator has been above 0.8, indicating a strong bullish trend.
Volume Indicators Analysis:
- On-Balance Volume (OBV): The OBV has been steadily increasing, reflecting strong buying volume.
- Chaikin Money Flow (CMF): The CMF has been positive, indicating that money is flowing into the stock.
Key Observations:
- The stock is in a strong uptrend, supported by moving averages, MACD, and volume indicators.
- Momentum indicators are in overbought territory, suggesting a potential pullback or consolidation in the short term.
- Volatility has been relatively stable, but the stock is trading near the upper Bollinger Band, indicating a possible overbought condition.
Conclusion:
Based on the technical indicators and analysis: - Short-Term: The stock may experience a slight pullback or consolidation in the next few days due to overbought conditions indicated by momentum indicators. - Medium- to Long-Term: The overall trend remains bullish, supported by moving averages and volume indicators. Therefore, any pullback could present a buying opportunity for investors looking to enter or add to their positions in the stock.
Recommendation:
- Short-Term Traders: Consider taking profits or waiting for a better entry point during a potential pullback.
- Long-Term Investors: Hold onto positions or consider accumulating more during any short-term weakness, as the overall trend remains bullish.
Key Words:
- Bullish Trend: Moving averages, MACD, and volume support an upward price movement.
- Overbought: Momentum indicators suggest caution for short-term traders.
- Potential Pullback: Short-term consolidation or correction expected.
- Long-Term Bullish: Overall outlook remains positive for the stock.