Technical Analysis of DIVY 2024-05-10
Overview:
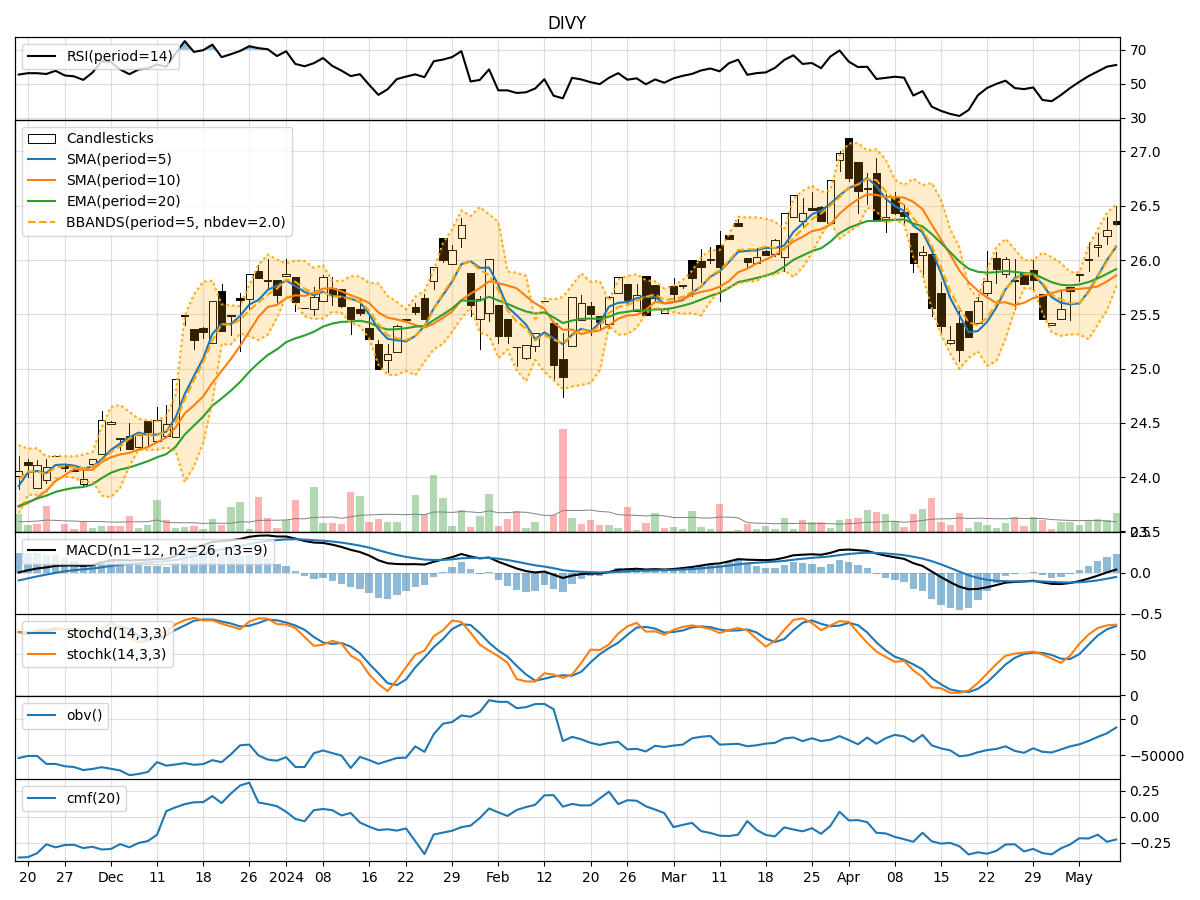
In the last 5 trading days, the stock price of DIVY has shown a gradual increase, accompanied by rising trading volumes. The trend indicators suggest a positive momentum with moving averages trending upwards. Momentum indicators like RSI and Stochastic oscillators indicate a strengthening bullish sentiment. Volatility indicators show a slight increase in volatility, while volume indicators reflect a mixed sentiment with some selling pressure.
Trend Analysis:
- Moving Averages (MA): The 5-day MA has been consistently above the longer-term SMAs, indicating a short-term bullish trend. The EMA(20) is also trending upwards, supporting the bullish sentiment.
- MACD: The MACD line has been consistently above the signal line, with both lines in positive territory. The MACD histogram has been increasing, indicating a strengthening bullish momentum.
Momentum Analysis:
- RSI: The RSI has been steadily increasing and is currently in the overbought territory, suggesting a strong bullish momentum.
- Stochastic Oscillators: Both %K and %D lines are in the overbought zone, indicating a strong buying pressure. The Williams %R is also in the oversold region, supporting the bullish sentiment.
Volatility Analysis:
- Bollinger Bands (BB): The bands have slightly widened, indicating a slight increase in volatility. The price has been trading near the upper band, suggesting a bullish trend.
Volume Analysis:
- On-Balance Volume (OBV): The OBV has shown a slight decrease, indicating some distribution happening in the stock.
- Chaikin Money Flow (CMF): The CMF has been negative, suggesting a bearish money flow over the past 20 days.
Conclusion:
Based on the technical analysis of DIVY stock: - Trend: The stock is in a strong upward trend supported by moving averages and MACD. - Momentum: The momentum indicators suggest a strong bullish sentiment with RSI and Stochastic oscillators in overbought territory. - Volatility: There is a slight increase in volatility, but the overall trend remains bullish. - Volume: The volume indicators show a mixed sentiment with some distribution happening.
Forecast:
Considering the overall bullish trend and strong momentum indicators, it is likely that the stock price of DIVY will continue its upward movement in the next few days. Traders and investors can consider buying opportunities on pullbacks to ride the bullish momentum. However, it is essential to monitor the volume closely to confirm the strength of the trend.