Technical Analysis of DJUN 2024-05-10
Overview:
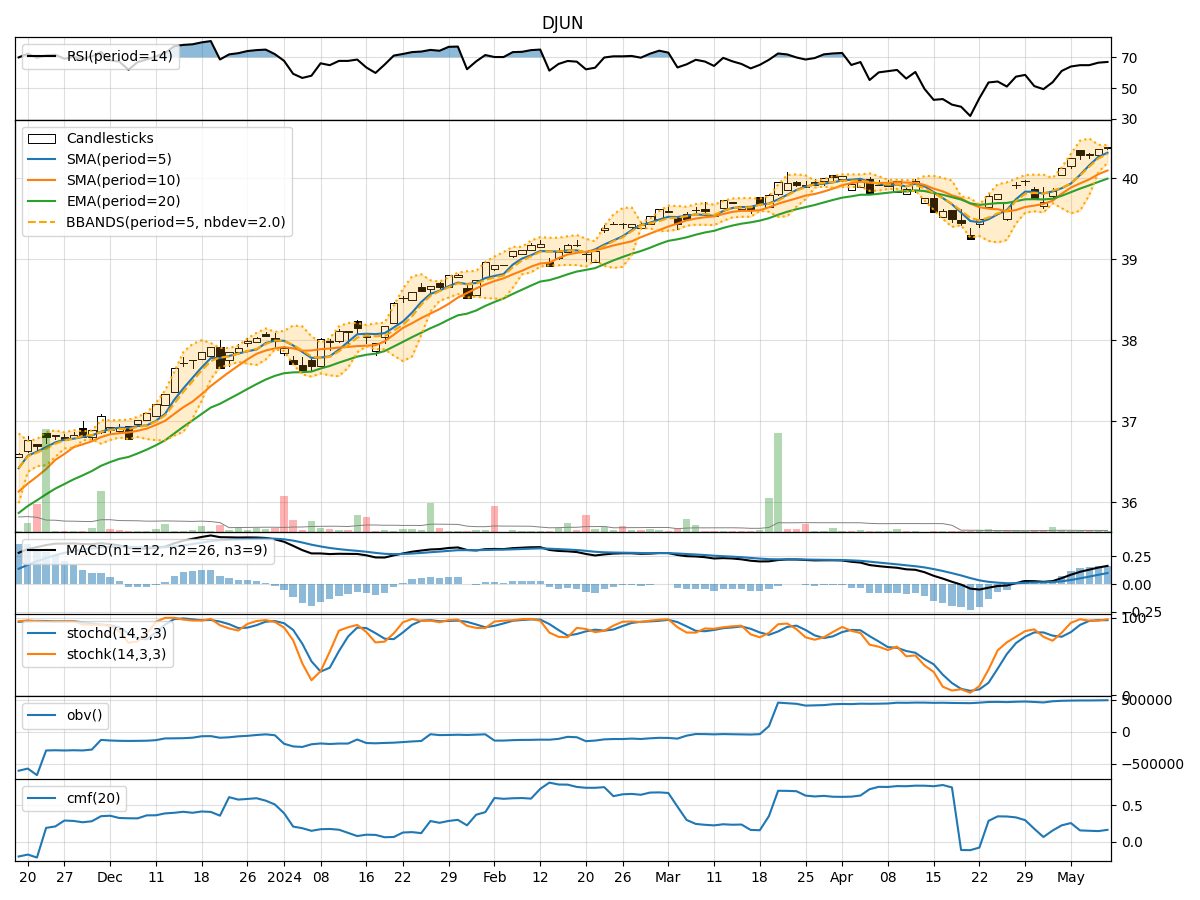
In the last 5 trading days, DJUN stock has shown a consistent uptrend in its price, with slight fluctuations in volume. The trend indicators suggest a positive momentum, supported by the moving averages and MACD. Momentum indicators like RSI and Stochastic oscillators indicate overbought conditions but still show strength. Volatility indicators show narrowing Bollinger Bands, indicating potential price consolidation. Volume indicators reflect a steady increase in On-Balance Volume (OBV) and Chaikin Money Flow (CMF), suggesting accumulation.
Trend Indicators Analysis:
- Moving Averages (MA): The 5-day MA is consistently above the 10-day SMA, indicating a short-term bullish trend.
- MACD: The MACD line is above the signal line, indicating a bullish momentum.
- EMA: The EMA is trending upwards, supporting the bullish sentiment.
Momentum Indicators Analysis:
- RSI: The RSI is in the overbought zone, suggesting a potential reversal or consolidation.
- Stochastic Oscillators: Both %K and %D are in the overbought region, signaling a possible pullback.
- Williams %R: The indicator is also in the overbought territory, indicating a potential reversal.
Volatility Indicators Analysis:
- Bollinger Bands: The narrowing of the bands suggests decreasing volatility and a possible period of consolidation.
- Bollinger %B: The %B is above 0.8, indicating a potential overbought condition.
- Bollinger Band Width: The decreasing width suggests a decrease in volatility.
Volume Indicators Analysis:
- OBV: The increasing OBV suggests that volume is flowing into the stock, supporting the uptrend.
- CMF: The rising CMF indicates buying pressure and accumulation.
Key Observations:
- The stock is currently in a strong uptrend, supported by moving averages and MACD.
- Momentum indicators show overbought conditions, signaling a potential reversal or consolidation.
- Volatility indicators suggest a period of consolidation due to narrowing Bollinger Bands.
- Volume indicators reflect accumulation and buying pressure.
Conclusion:
Based on the technical analysis of the trend, momentum, volatility, and volume indicators, the next few days for DJUN stock are likely to see a sideways movement or a slight pullback. The overbought conditions indicated by momentum oscillators and narrowing Bollinger Bands suggest a potential consolidation phase. Traders may consider taking profits or waiting for a better entry point before considering long positions. It is essential to monitor the price action closely for any signs of a reversal or continuation of the current uptrend.