Technical Analysis of DLN 2024-05-10
Overview:
In analyzing the technical indicators for DLN over the last 5 days, we will delve into the trend, momentum, volatility, and volume indicators to provide a comprehensive outlook on the possible stock price movement in the coming days. By examining these key aspects, we aim to offer valuable insights and predictions to guide investment decisions.
Trend Analysis:
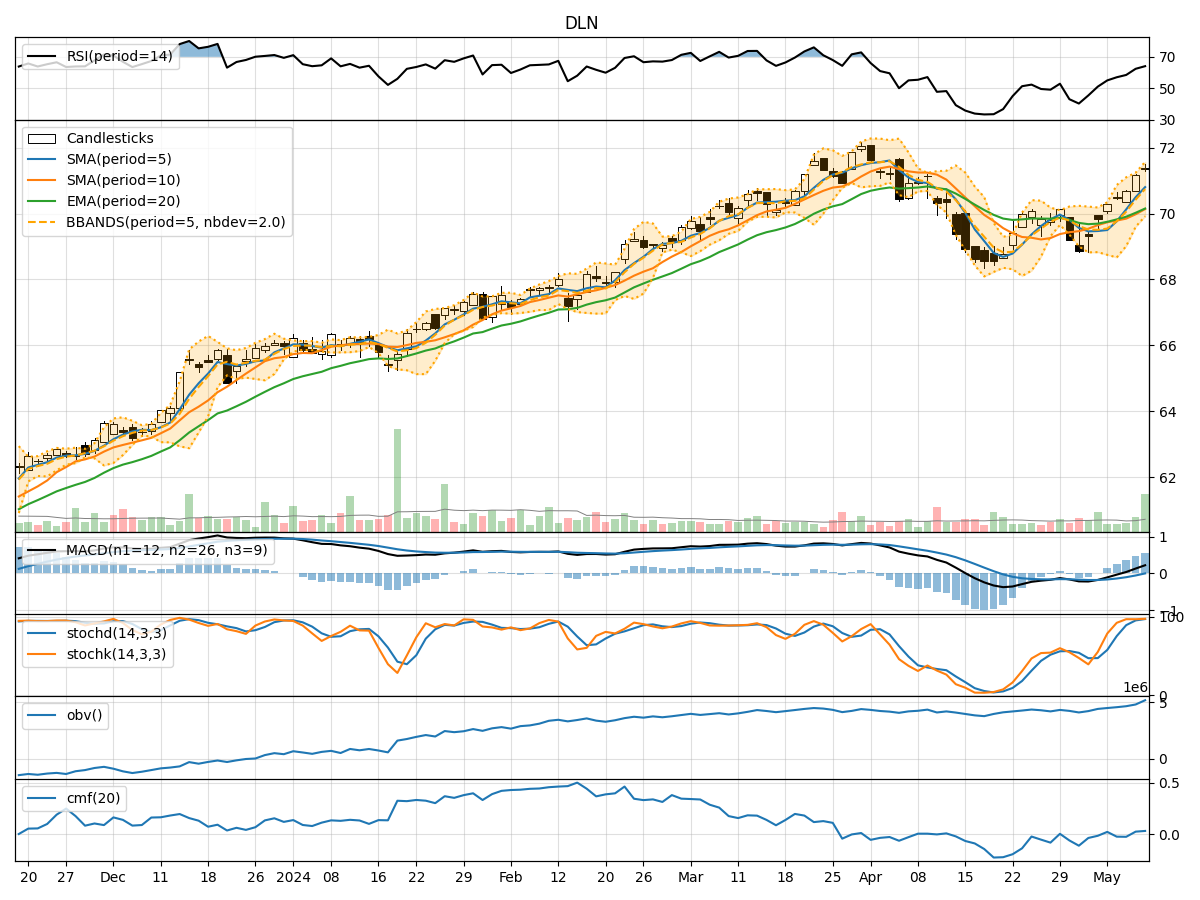
- Moving Averages (MA): The 5-day Moving Average (MA) has been consistently trending upwards, indicating a positive momentum in the stock price.
- MACD: The Moving Average Convergence Divergence (MACD) has shown an increasing trend, with the MACD line crossing above the signal line, suggesting a bullish signal.
- RSI: The Relative Strength Index (RSI) has been gradually increasing, reflecting strengthening buying pressure in the stock.
Momentum Analysis:
- Stochastic Oscillator: Both %K and %D values of the Stochastic Oscillator are in the overbought territory, signaling a potential reversal or consolidation in the stock price.
- Williams %R: The Williams %R indicator is also in the overbought zone, indicating a possible pullback in the stock price.
Volatility Analysis:
- Bollinger Bands: The Bollinger Bands are relatively narrow, suggesting low volatility in the stock price. This could indicate a period of consolidation or a potential breakout in the near future.
Volume Analysis:
- On-Balance Volume (OBV): The OBV indicator has been steadily increasing, indicating strong buying volume in the stock.
- Chaikin Money Flow (CMF): The CMF indicator is positive, suggesting that money is flowing into the stock.
Conclusion:
Based on the analysis of the technical indicators, the next few days' possible stock price movement for DLN is likely to be sideways to slightly bullish. The trend indicators show a positive momentum, supported by the increasing moving averages and MACD. However, the overbought signals from the momentum indicators suggest a potential pullback or consolidation in the short term. The low volatility indicated by the Bollinger Bands could lead to a period of sideways movement before a potential breakout.
In conclusion, while the overall trend is bullish, investors should be cautious of a possible short-term correction or consolidation before the stock resumes its upward trajectory. It is advisable to closely monitor the key technical levels and wait for confirmation signals before making any trading decisions.