Technical Analysis of DMAR 2024-05-10
Overview:
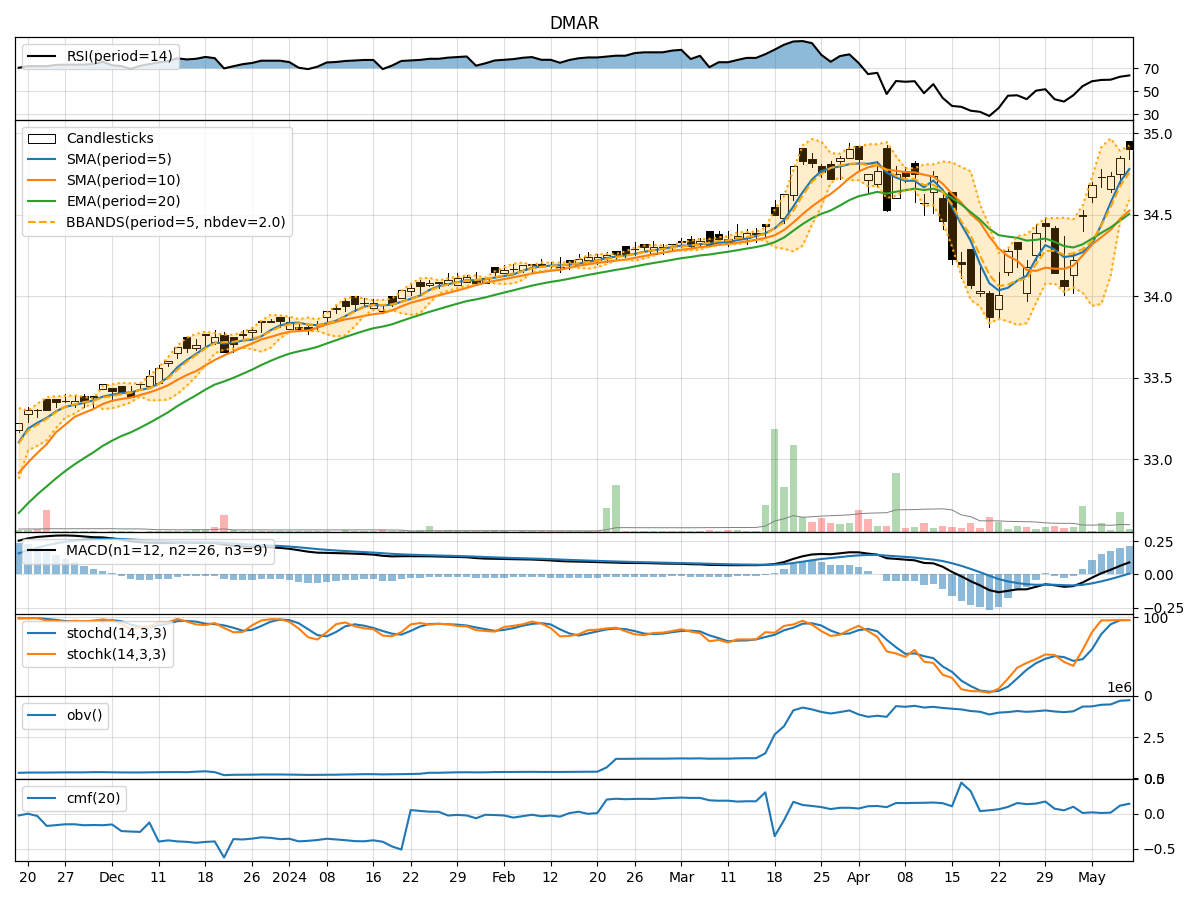
In the last 5 trading days, the stock price of DMAR has shown a gradual increase with fluctuating volumes. The trend indicators suggest a positive momentum with moving averages and MACD showing upward trends. Momentum indicators like RSI and Stochastic oscillators indicate overbought conditions. Volatility indicators show narrowing Bollinger Bands, indicating potential price consolidation. Volume indicators show a slight increase in On-Balance Volume (OBV) and Chaikin Money Flow (CMF), suggesting some accumulation.
Trend Indicators:
- Moving Averages (MA): The 5-day MA is consistently above the 10-day SMA, indicating a short-term bullish trend.
- MACD: The MACD line is above the signal line, indicating a bullish trend.
Key Observation: The stock is in an upward trend based on moving averages and MACD.
Momentum Indicators:
- RSI: RSI is in the overbought zone, suggesting a potential reversal or consolidation.
- Stochastic Oscillators: Stochastics are also in the overbought region, indicating a possible pullback.
Key Observation: Momentum indicators suggest the stock is overbought and may experience a reversal or consolidation.
Volatility Indicators:
- Bollinger Bands (BB): The bands are narrowing, indicating decreasing volatility and a potential price consolidation.
Key Observation: Volatility is decreasing, suggesting a period of consolidation in the stock price.
Volume Indicators:
- On-Balance Volume (OBV): OBV has shown a slight increase, indicating some accumulation.
- Chaikin Money Flow (CMF): CMF is positive, suggesting buying pressure.
Key Observation: Volume indicators show mild accumulation and buying pressure.
Conclusion:
Based on the technical analysis of trend, momentum, volatility, and volume indicators, the next few days' possible stock price movement for DMAR is likely to experience a period of consolidation or a potential pullback. The stock is currently in an upward trend but is showing signs of being overbought according to momentum indicators. The decreasing volatility and mild accumulation in volume suggest a sideways movement or a brief correction in the stock price.
Recommendation:
- Short-term Traders: Consider taking profits or tightening stop-loss levels due to overbought conditions.
- Long-term Investors: Monitor the stock closely for a potential pullback to accumulate at lower levels.
Overall View: The stock is likely to enter a consolidation phase or experience a short-term correction before potentially resuming its upward trend.