Technical Analysis of DMCY 2024-05-10
Overview:
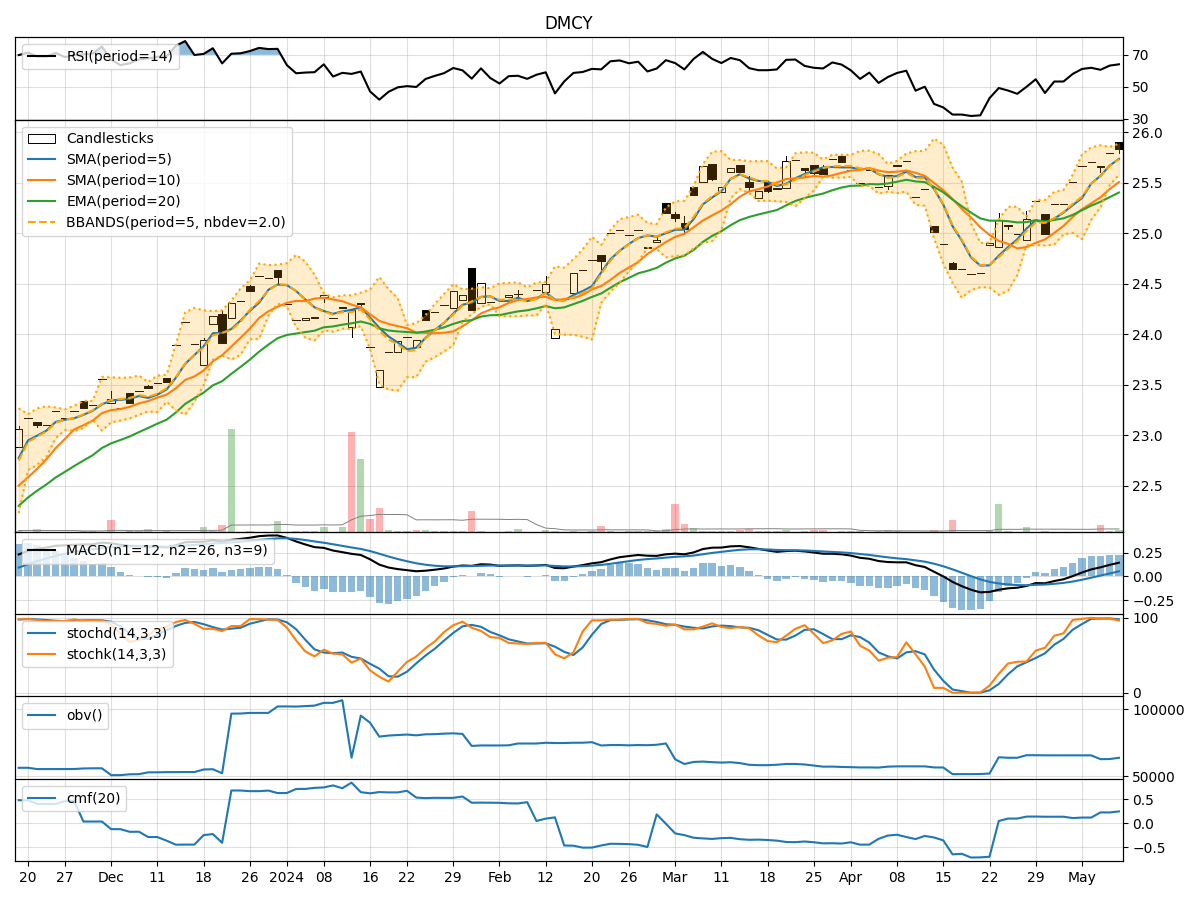
In analyzing the technical indicators for DMCY over the last 5 days, we will delve into the trend, momentum, volatility, and volume indicators to provide a comprehensive outlook on the possible stock price movement in the coming days. By examining these key indicators, we aim to offer valuable insights and predictions to guide your investment decisions.
Trend Analysis:
- Moving Averages (MA): The 5-day Moving Average (MA) has been consistently above the Simple Moving Average (SMA) and Exponential Moving Average (EMA), indicating a bullish trend.
- MACD: The MACD line has been consistently above the signal line, suggesting positive momentum in the stock price.
- RSI: The Relative Strength Index (RSI) has been fluctuating around the overbought territory, indicating strong buying pressure.
Momentum Analysis:
- Stochastic Oscillator: The Stochastic Oscillator has been in the overbought zone, suggesting a potential reversal or consolidation.
- Williams %R: The Williams %R indicator has been showing oversold conditions, signaling a possible buying opportunity.
Volatility Analysis:
- Bollinger Bands (BB): The Bollinger Bands have been relatively narrow, indicating low volatility in the stock price.
- BB% (Bollinger Band %B): The %B indicator has been hovering around the middle range, suggesting a balanced market sentiment.
Volume Analysis:
- On-Balance Volume (OBV): The OBV has been fluctuating, indicating mixed buying and selling pressure.
- Chaikin Money Flow (CMF): The CMF has been positive, suggesting inflow of money into the stock.
Key Observations:
- The trend indicators point towards a bullish sentiment with moving averages and MACD supporting an upward trend.
- Momentum indicators show a mixed signal with Stochastic Oscillator in the overbought zone and Williams %R in the oversold territory.
- Volatility indicators suggest low volatility in the stock price, potentially leading to a period of consolidation.
- Volume indicators reflect mixed buying and selling pressure, indicating indecision in the market.
Conclusion:
Based on the analysis of the technical indicators, the next few days for DMCY stock price movement could see sideways consolidation with a slight upward bias. Traders may consider waiting for clearer signals from momentum indicators before making significant trading decisions. It is essential to monitor the price action closely and be prepared for potential reversals or breakouts based on changing market dynamics.
Disclaimer:
Remember that technical analysis is not a guaranteed predictor of future price movements, and other fundamental factors and market dynamics can influence stock prices. It is crucial to conduct thorough research and consider multiple indicators before making any investment decisions. Consulting with a financial advisor can provide personalized insights tailored to your specific investment goals and risk tolerance level.