Technical Analysis of DMDV 2024-05-10
Overview:
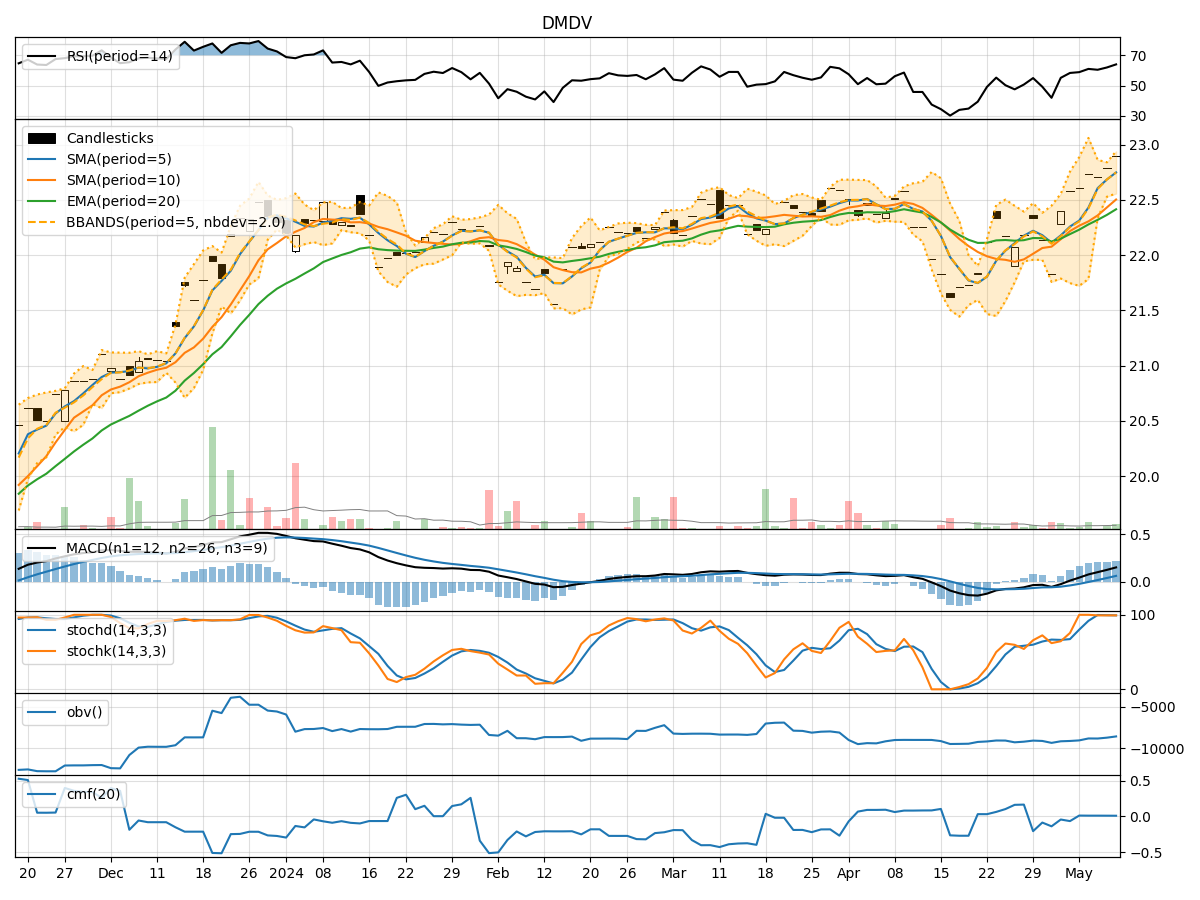
In analyzing the technical indicators for DMDV stock over the last 5 days, we will delve into the trend, momentum, volatility, and volume indicators to provide a comprehensive outlook on the possible future stock price movement. By examining key metrics such as moving averages, MACD, RSI, Bollinger Bands, and volume trends, we aim to offer valuable insights and predictions for the upcoming trading days.
Trend Indicators:
- Moving Averages (MA): The 5-day moving average has been consistently above the 10-day simple moving average, indicating a short-term bullish trend.
- MACD: The MACD line has been trending upwards, with the MACD histogram showing positive values, suggesting increasing bullish momentum.
- EMA: The exponential moving average has been on an upward trajectory, further supporting the bullish sentiment.
Momentum Indicators:
- RSI: The Relative Strength Index has been in the 60-64 range, indicating a moderate bullish momentum.
- Stochastic Oscillator: Both %K and %D have been consistently high, signaling strong buying pressure.
- Williams %R: The indicator has been hovering around 0, suggesting the stock is nearing overbought conditions.
Volatility Indicators:
- Bollinger Bands: The stock price has been trading within the upper Bollinger Band, indicating an overbought condition.
- Bollinger Band Width: The band width has been narrowing, suggesting a potential decrease in volatility.
- Bollinger Band %B: The %B indicator has been above 0.8, indicating a high price relative to the bands.
Volume Indicators:
- On-Balance Volume (OBV): The OBV has shown mixed signals, with some days experiencing selling pressure and others showing accumulation.
- Chaikin Money Flow (CMF): The CMF has been relatively stable around 0.01, indicating a neutral money flow trend.
Key Observations and Opinions:
- Trend: The stock is in a short-term bullish trend, supported by moving averages and MACD.
- Momentum: The momentum indicators suggest a strong buying pressure, but the stock is approaching overbought levels.
- Volatility: The narrowing Bollinger Bands and high %B indicate a potential consolidation phase.
- Volume: The volume indicators show mixed signals, reflecting uncertainty in market participation.
Conclusion:
Based on the analysis of the technical indicators, the next few days' possible stock price movement for DMDV is likely to experience a consolidation phase with a slight downward bias. Traders should exercise caution as the stock may enter a period of sideways trading before establishing a clear direction. It is advisable to monitor key support and resistance levels closely to identify potential entry or exit points.