Technical Analysis of DNOV 2024-05-10
Overview:
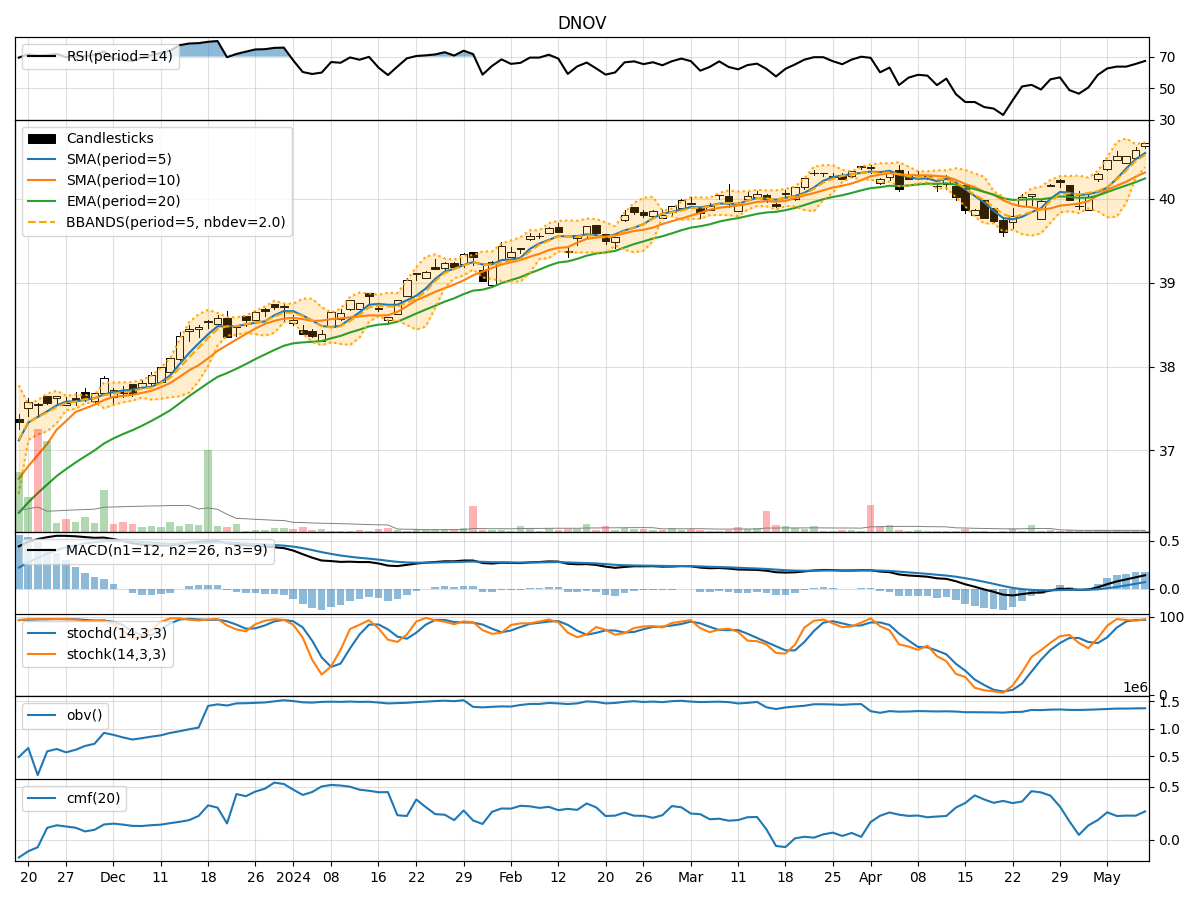
In analyzing the technical indicators for DNOV over the last 5 days, we will delve into the trends, momentum, volatility, and volume aspects to provide a comprehensive outlook on the possible stock price movement. By examining key indicators such as moving averages, MACD, RSI, Bollinger Bands, and OBV, we aim to offer valuable insights and predictions for the upcoming days.
Trend Analysis:
- Moving Averages (MA): The 5-day MA has been consistently above the closing prices, indicating a bullish trend.
- MACD: The MACD line has been above the signal line, with both lines showing an upward trend, suggesting bullish momentum.
Momentum Analysis:
- RSI: The RSI has been in the overbought territory, indicating strong buying momentum.
- Stochastic Oscillator: Both %K and %D have been in the overbought zone, suggesting a potential reversal or consolidation.
Volatility Analysis:
- Bollinger Bands: The stock price has been trading within the bands, with the bands narrowing, indicating reduced volatility.
Volume Analysis:
- On-Balance Volume (OBV): The OBV has been declining, suggesting a divergence between price and volume, which could signal a potential trend reversal.
Key Observations:
- The stock has shown a strong bullish trend based on moving averages and MACD.
- Momentum indicators like RSI and Stochastic Oscillator point towards overbought conditions.
- Volatility has been decreasing, indicating a possible period of consolidation.
- The declining OBV raises concerns about the sustainability of the current uptrend.
Conclusion:
Based on the technical indicators and analysis: - Trend: The stock is in an upward trend supported by moving averages and MACD. - Momentum: Momentum indicators suggest a potential reversal due to overbought conditions. - Volatility: The decreasing volatility implies a period of consolidation may be on the horizon. - Volume: The declining OBV raises concerns about the strength of the current uptrend.
Recommendation:
Considering the mixed signals from the indicators, it is advisable to exercise caution in the upcoming days. Traders may consider taking profits on existing positions or waiting for a clearer signal before entering new positions. Keep a close eye on key support and resistance levels for potential entry or exit points.
Disclaimer:
Remember that technical analysis is not foolproof and should be used in conjunction with other forms of analysis. Market conditions can change rapidly, so it's essential to stay informed and adapt your strategy accordingly. Consulting with a financial advisor or conducting further research is always recommended before making investment decisions.