Technical Analysis of DRIP 2024-05-10
Overview:
In analyzing the technical indicators for DRIP over the last 5 days, we will delve into the trend, momentum, volatility, and volume indicators to provide a comprehensive outlook on the possible stock price movement in the coming days. By examining these key aspects, we aim to offer valuable insights and predictions to guide investment decisions.
Trend Analysis:
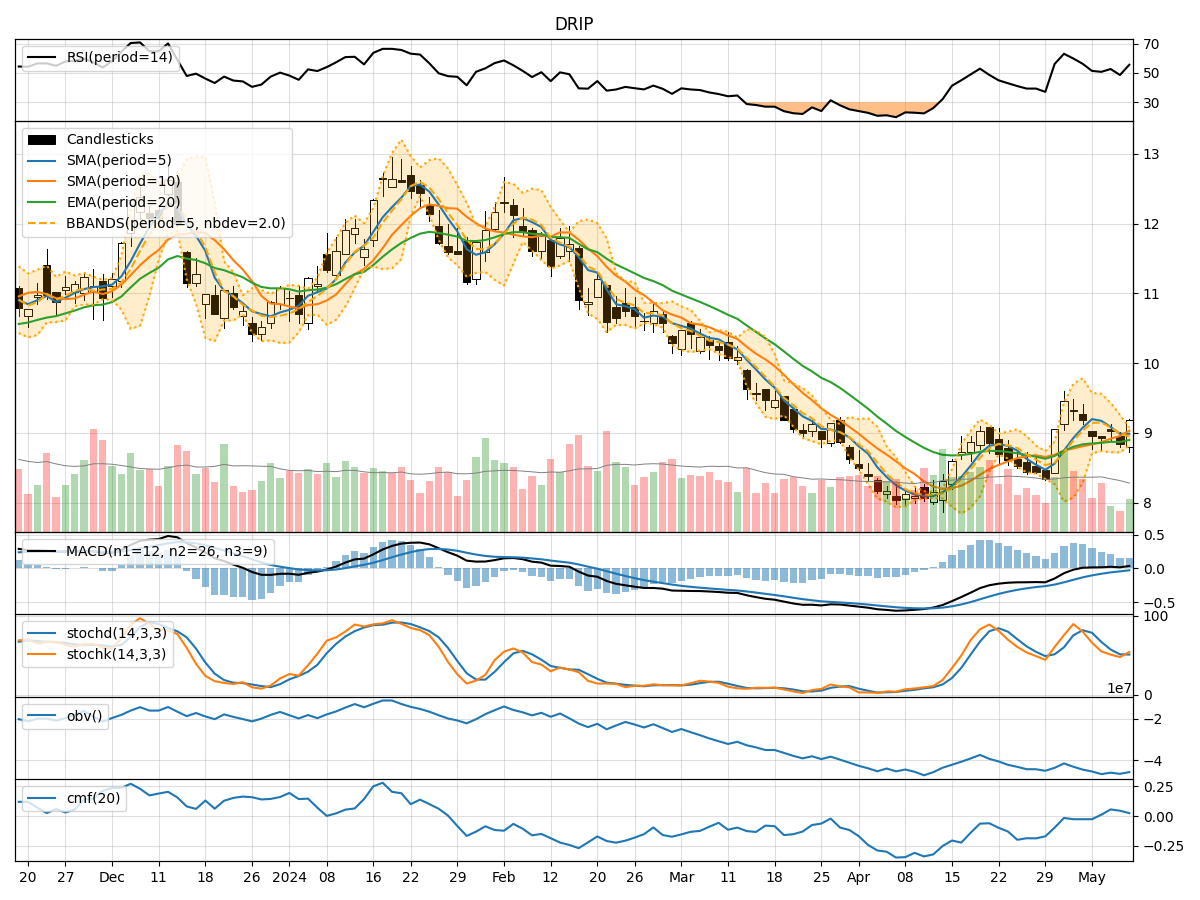
- Moving Averages (MA): The 5-day MA has been consistently below the closing prices, indicating a short-term downtrend.
- MACD: The MACD line has been positive, suggesting bullish momentum, but the MACD Histogram has been decreasing, signaling a potential reversal.
- EMA: The EMA has been fluctuating around the closing prices, reflecting indecision in the trend direction.
Momentum Analysis:
- RSI: The RSI has been hovering around the neutral zone, indicating a lack of strong momentum in either direction.
- Stochastic Oscillator: Both %K and %D have been fluctuating, showing mixed signals in momentum.
- Williams %R: The indicator has been moving between overbought and oversold levels, suggesting indecision among traders.
Volatility Analysis:
- Bollinger Bands (BB): The bands have been narrowing, indicating decreasing volatility and a potential period of consolidation.
- Bollinger %B: The %B has been fluctuating, reflecting uncertainty in price direction within the bands.
Volume Analysis:
- On-Balance Volume (OBV): The OBV has been slightly decreasing, suggesting some distribution of shares.
- Chaikin Money Flow (CMF): The CMF has been positive, indicating buying pressure, but the 20-day average shows a slight decline.
Key Observations:
- The trend indicators show a mixed picture with conflicting signals between moving averages and MACD.
- Momentum indicators suggest a lack of clear direction in price movement.
- Volatility is decreasing, pointing towards a potential period of consolidation.
- Volume indicators indicate some distribution of shares but with ongoing buying pressure.
Conclusion:
Based on the analysis of the technical indicators, the next few days for DRIP could see sideways movement or consolidation as the stock lacks a clear trend and momentum direction. Traders should exercise caution and wait for more definitive signals before taking significant positions. It is advisable to closely monitor key levels and wait for a breakout or breakdown before making trading decisions.