Technical Analysis of DRSK 2024-05-10
Overview:
In analyzing the technical indicators for DRSK over the last 5 days, we will delve into the trend, momentum, volatility, and volume indicators to provide a comprehensive outlook on the possible stock price movement in the coming days. By examining these key indicators, we aim to offer valuable insights and predictions for informed decision-making.
Trend Indicators:
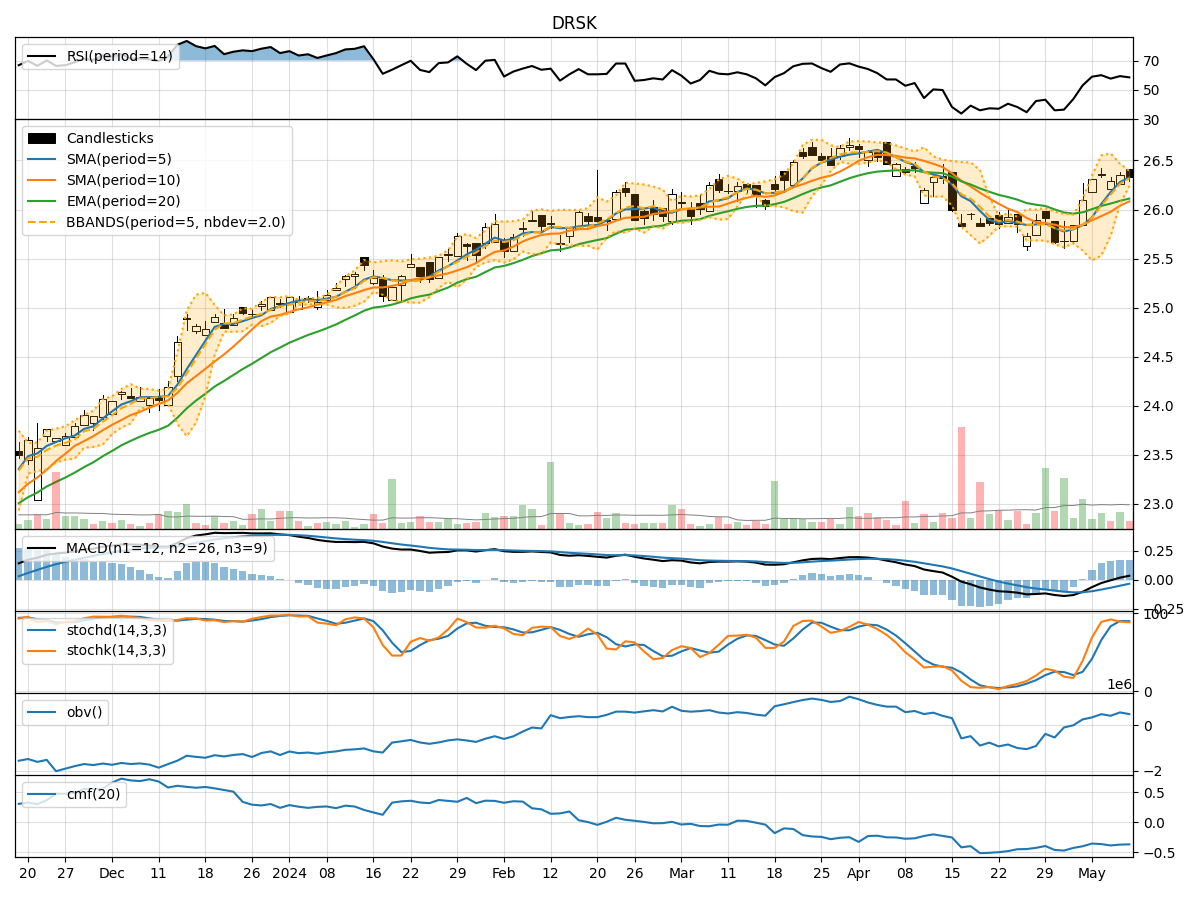
- Moving Averages (MA): The 5-day MA has been consistently above the 10-day SMA, indicating a short-term bullish trend. The EMA(20) has shown a slight upward trajectory, suggesting a positive momentum in the stock price.
- MACD: The MACD line has been above the signal line for the past few days, indicating a bullish trend. The MACD histogram has also been in positive territory, further supporting the bullish sentiment.
Momentum Indicators:
- RSI: The RSI has been hovering around the 60-70 range, indicating a neutral to slightly bullish momentum. There is room for potential upside movement before reaching overbought levels.
- Stochastic Oscillator: Both %K and %D lines of the Stochastic oscillator have been in the overbought zone, suggesting a potential reversal or consolidation in the stock price.
- Williams %R: The Williams %R has been fluctuating around the oversold territory, indicating a potential buying opportunity.
Volatility Indicators:
- Bollinger Bands: The stock price has been trading within the Bollinger Bands, with the bands narrowing in recent days. This suggests a period of consolidation or decreased volatility in the stock price.
- Bollinger %B: The %B indicator is currently below 1, indicating that the stock price is trading below the upper Bollinger Band, potentially signaling a short-term pullback or consolidation.
Volume Indicators:
- On-Balance Volume (OBV): The OBV has shown mixed signals, with fluctuations in volume accumulation. This indicates indecision among market participants regarding the stock.
- Chaikin Money Flow (CMF): The CMF has been negative, suggesting that money is flowing out of the stock. This could be a bearish signal for the stock price.
Conclusion:
Based on the analysis of the technical indicators, the stock price of DRSK is likely to experience sideways movement or consolidation in the coming days. The trend indicators point towards a bullish bias, supported by the moving averages and MACD. However, the momentum indicators suggest a potential reversal or consolidation due to overbought conditions in the Stochastic oscillator.
Considering the mixed signals from volume and volatility indicators, it is crucial for investors to exercise caution and closely monitor the price action. Overall, a cautious outlook is recommended, with a focus on key support and resistance levels to navigate potential price fluctuations in the near term.