Technical Analysis of DRUP 2024-05-10
Overview:
In analyzing the technical indicators for DRUP over the last 5 days, we will delve into the trend, momentum, volatility, and volume indicators to provide a comprehensive outlook on the possible stock price movement. By examining these key aspects, we aim to offer valuable insights and predictions for the upcoming days.
Trend Analysis:
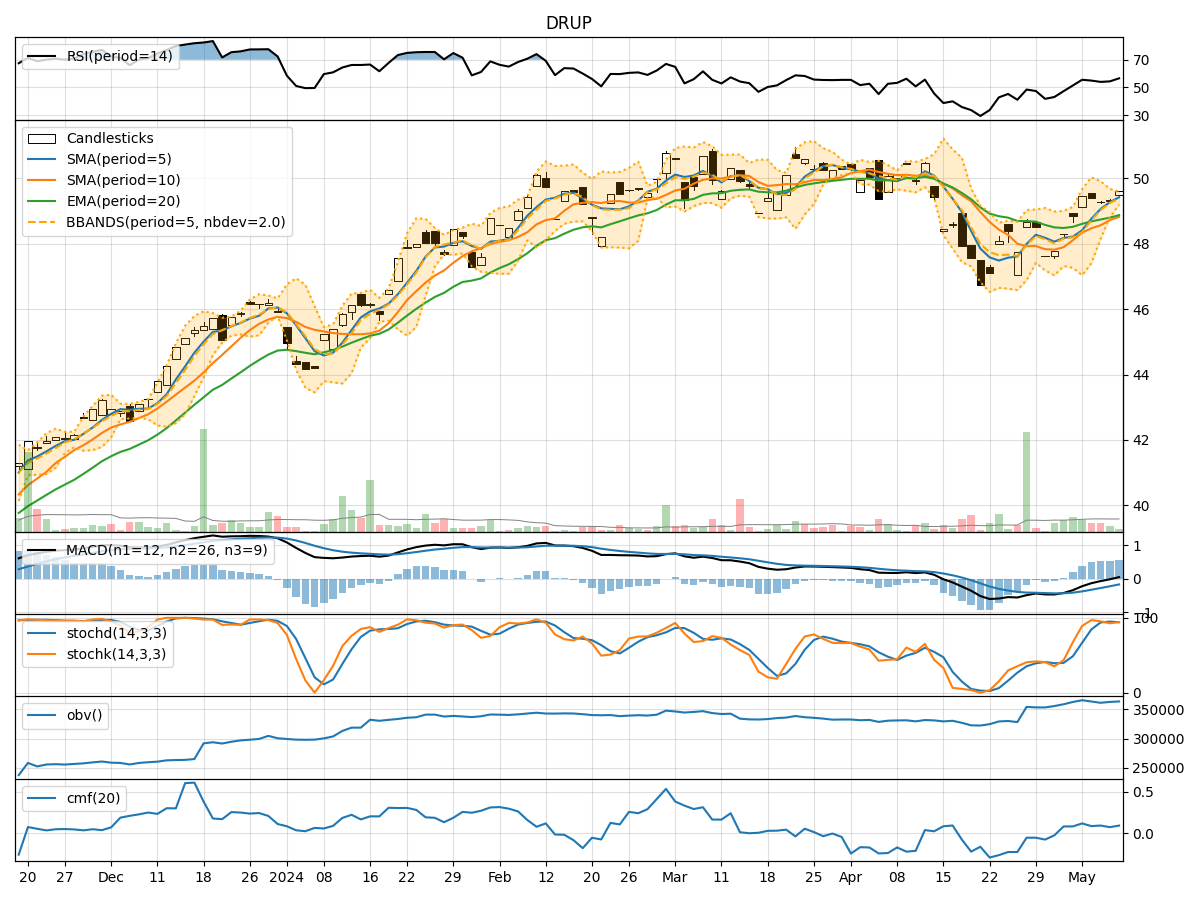
- Moving Averages (MA): The 5-day Moving Average (MA) has been consistently above the Simple Moving Average (SMA) and Exponential Moving Average (EMA), indicating a bullish trend.
- MACD: The Moving Average Convergence Divergence (MACD) has been positive, with the MACD line above the signal line, suggesting upward momentum.
- MACD Histogram: The MACD Histogram has been increasing, further supporting the bullish trend.
Momentum Analysis:
- RSI: The Relative Strength Index (RSI) has been fluctuating around the mid-level, indicating a neutral momentum.
- Stochastic Oscillator: Both %K and %D have been hovering around the overbought zone, suggesting a potential reversal.
- Williams %R: The Williams %R has shown mixed signals, with some days in the oversold territory and others near the neutral zone.
Volatility Analysis:
- Bollinger Bands: The Bollinger Bands have been narrowing, indicating decreasing volatility.
- Bollinger %B: The %B indicator has been fluctuating within a tight range, reflecting the consolidation phase.
- Bollinger Band Width: The Band Width has been contracting, signaling a potential breakout or breakdown.
Volume Analysis:
- On-Balance Volume (OBV): The OBV has shown a slight increase, suggesting some accumulation.
- Chaikin Money Flow (CMF): The CMF has been positive but relatively flat, indicating stable money flow.
Key Observations:
- The trend indicators suggest a bullish bias, supported by the positive MACD and moving averages.
- Momentum indicators show mixed signals, with RSI indicating neutrality and stochastic oscillators hinting at a possible reversal.
- Volatility has been decreasing, indicating a period of consolidation.
- Volume indicators reflect some accumulation but with stable money flow.
Conclusion:
Based on the analysis of the technical indicators, the stock is likely to experience a period of consolidation in the upcoming days. The bullish trend may continue, but with a potential for a minor pullback or sideways movement. Traders should monitor key support and resistance levels for potential entry or exit points. It is advisable to exercise caution and wait for clearer signals before making significant trading decisions.