Technical Analysis of DSCF 2024-05-10
Overview:
In analyzing the technical indicators for DSCF stock over the last 5 days, we will delve into the trend, momentum, volatility, and volume indicators to provide a comprehensive outlook on the possible stock price movement in the coming days. By examining these key indicators, we aim to offer valuable insights and make informed predictions regarding the future direction of DSCF stock.
Trend Indicators:
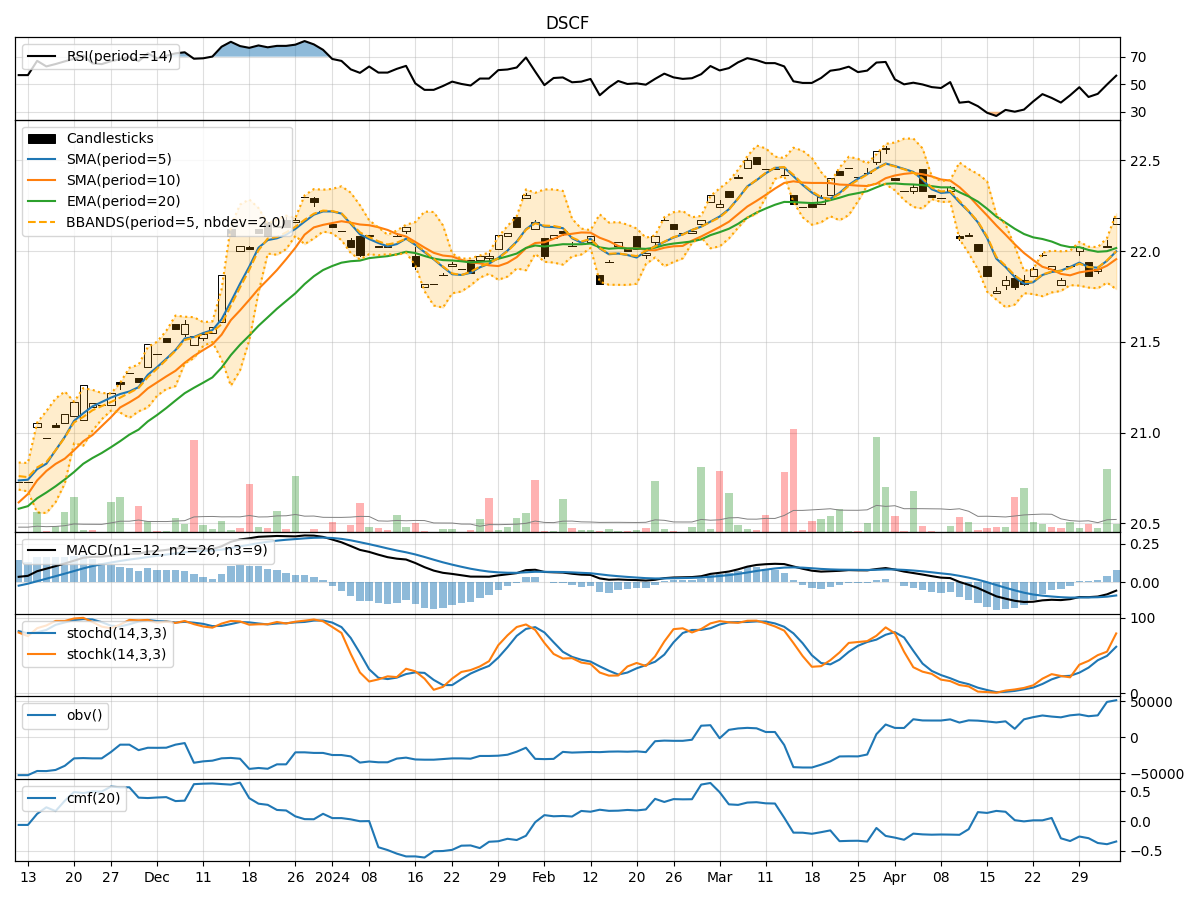
- Moving Averages (MA): The 5-day Moving Average (MA) has been consistently above the Simple Moving Average (SMA) and Exponential Moving Average (EMA), indicating a bullish trend.
- MACD: The MACD line has been consistently above the signal line, with both lines showing an upward trend, suggesting bullish momentum.
- MACD Histogram: The MACD Histogram has been increasing over the past 5 days, indicating strengthening bullish momentum.
Momentum Indicators:
- RSI: The Relative Strength Index (RSI) has been fluctuating around the 60 level, indicating a neutral momentum.
- Stochastic Oscillator: Both %K and %D have been fluctuating within a range, suggesting a lack of clear momentum direction.
- Williams %R: The Williams %R has been hovering around oversold levels, indicating a potential reversal in momentum.
Volatility Indicators:
- Bollinger Bands: The Bollinger Bands have been narrowing, indicating decreasing volatility in the stock price.
- Bollinger %B: The %B indicator has been hovering around the middle range, suggesting a neutral volatility outlook.
Volume Indicators:
- On-Balance Volume (OBV): The OBV has been relatively stable, indicating no significant divergence between price and volume.
- Chaikin Money Flow (CMF): The CMF has been negative, suggesting a bearish money flow trend.
Key Observations and Opinions:
- Trend: The trend indicators suggest a strong bullish sentiment in the stock, supported by the moving averages and MACD analysis.
- Momentum: The momentum indicators show a mixed signal, with RSI indicating neutrality and stochastic oscillators suggesting a lack of clear direction.
- Volatility: Volatility has been decreasing, as indicated by the narrowing Bollinger Bands, which may lead to a period of consolidation.
- Volume: The volume indicators point to a bearish money flow trend, as indicated by the negative CMF.
Conclusion:
Based on the analysis of the technical indicators, the next few days for DSCF stock are likely to see sideways movement with a slight bearish bias. The bullish trend indicated by the trend indicators may face resistance due to the lack of clear momentum direction and negative money flow trend. Traders should exercise caution and consider potential consolidation in the stock price.