Technical Analysis of DSMC 2024-05-10
Overview:
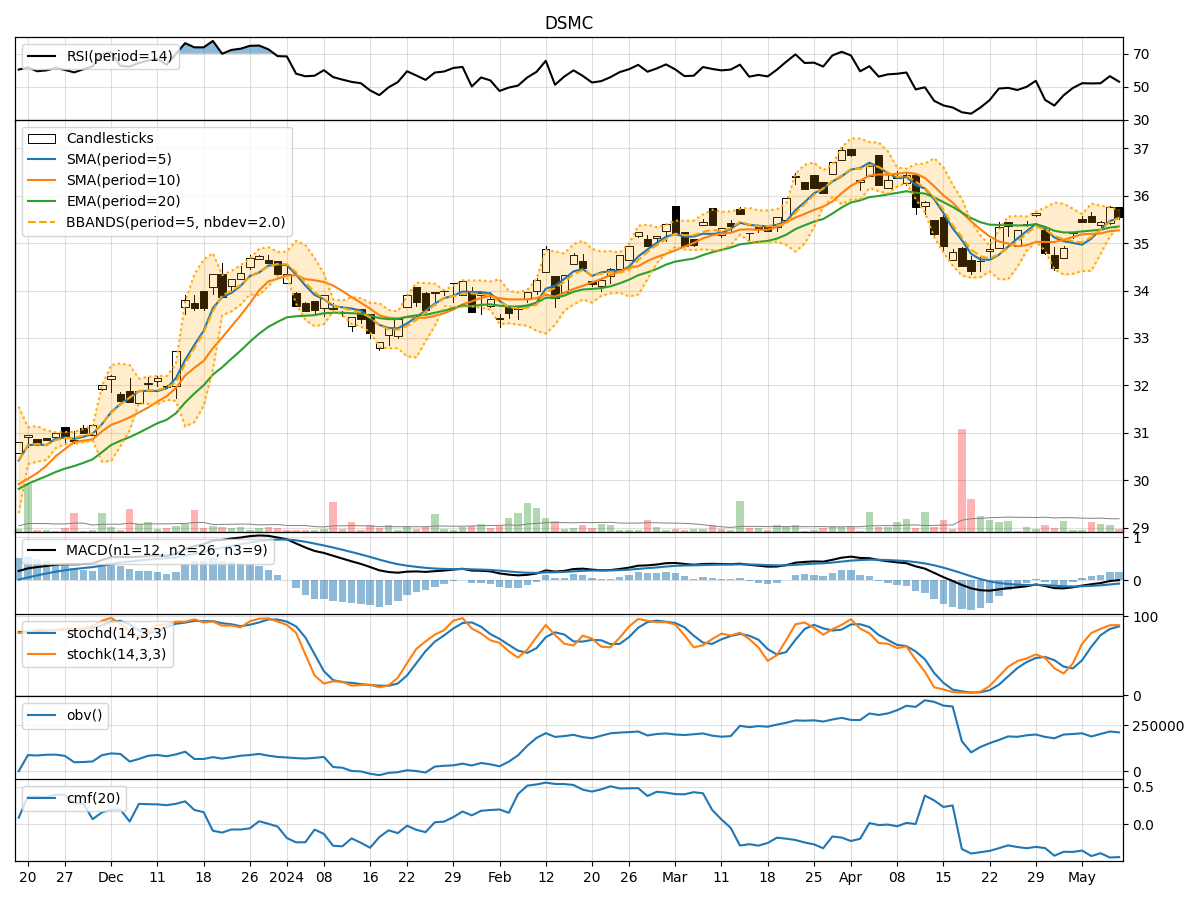
In the last 5 trading days, DSMC stock has shown mixed signals across various technical indicators. The trend indicators suggest a slightly bullish sentiment, with the moving averages trending upwards. Momentum indicators show a mixed picture, with RSI hovering around the neutral zone. Volatility indicators indicate a narrowing of the Bollinger Bands, potentially signaling a period of consolidation. Volume indicators show a slight decrease in On-Balance Volume (OBV) and Chaikin Money Flow (CMF), indicating some selling pressure.
Trend Indicators:
- Moving Averages (MA): The 5-day MA is trending above the 10-day SMA and 20-day EMA, indicating a short-term bullish trend.
- MACD: The MACD line is slightly below the signal line, but the MACD Histogram is positive, suggesting a potential bullish momentum.
- Conclusion: The trend indicators point towards a slightly bullish outlook for DSMC stock.
Momentum Indicators:
- RSI: The RSI is around 50, indicating a neutral sentiment without any extreme overbought or oversold conditions.
- Stochastic Oscillator: Both %K and %D are in the overbought zone, suggesting a potential reversal or consolidation.
- Williams %R: The Williams %R is close to oversold levels, indicating a possible buying opportunity.
- Conclusion: The momentum indicators are mixed, with no clear direction for the stock.
Volatility Indicators:
- Bollinger Bands (BB): The bands are narrowing, indicating decreasing volatility and a potential period of consolidation.
- Conclusion: The volatility indicators suggest a consolidation phase for DSMC stock.
Volume Indicators:
- On-Balance Volume (OBV): The OBV has shown a slight decrease over the last few days, indicating some distribution.
- Chaikin Money Flow (CMF): The CMF is negative, suggesting selling pressure in the stock.
- Conclusion: The volume indicators point towards some selling pressure in DSMC stock.
Overall Conclusion:
Based on the analysis of the technical indicators, the next few days for DSMC stock are likely to see sideways movement with a slight bullish bias. The trend indicators support a bullish outlook, while momentum indicators are mixed, suggesting a lack of strong buying or selling pressure. Volatility indicators point towards a consolidation phase, and volume indicators indicate some selling pressure. Therefore, investors should be cautious and monitor the stock closely for any potential shifts in market sentiment.
Key Recommendations:
- Monitor Price Action: Keep a close eye on the price action to identify any breakout or breakdown from the consolidation phase.
- Watch Volume Trends: Monitor volume trends to confirm any potential shifts in market sentiment.
- Consider Risk Management: Implement proper risk management strategies to protect against unexpected price movements.
- Stay Informed: Stay updated on any news or events that could impact DSMC stock price.
Disclaimer:
This analysis is based solely on technical indicators and does not take into account fundamental factors or external market influences. It is essential to conduct thorough research and consider all aspects before making any investment decisions.