Technical Analysis of DSTL 2024-05-10
Overview:
In analyzing the technical indicators for DSTL over the last 5 days, we will delve into the trend, momentum, volatility, and volume indicators to provide a comprehensive outlook on the possible stock price movement in the coming days. By examining these key aspects, we aim to offer valuable insights and predictions to guide investment decisions.
Trend Analysis:
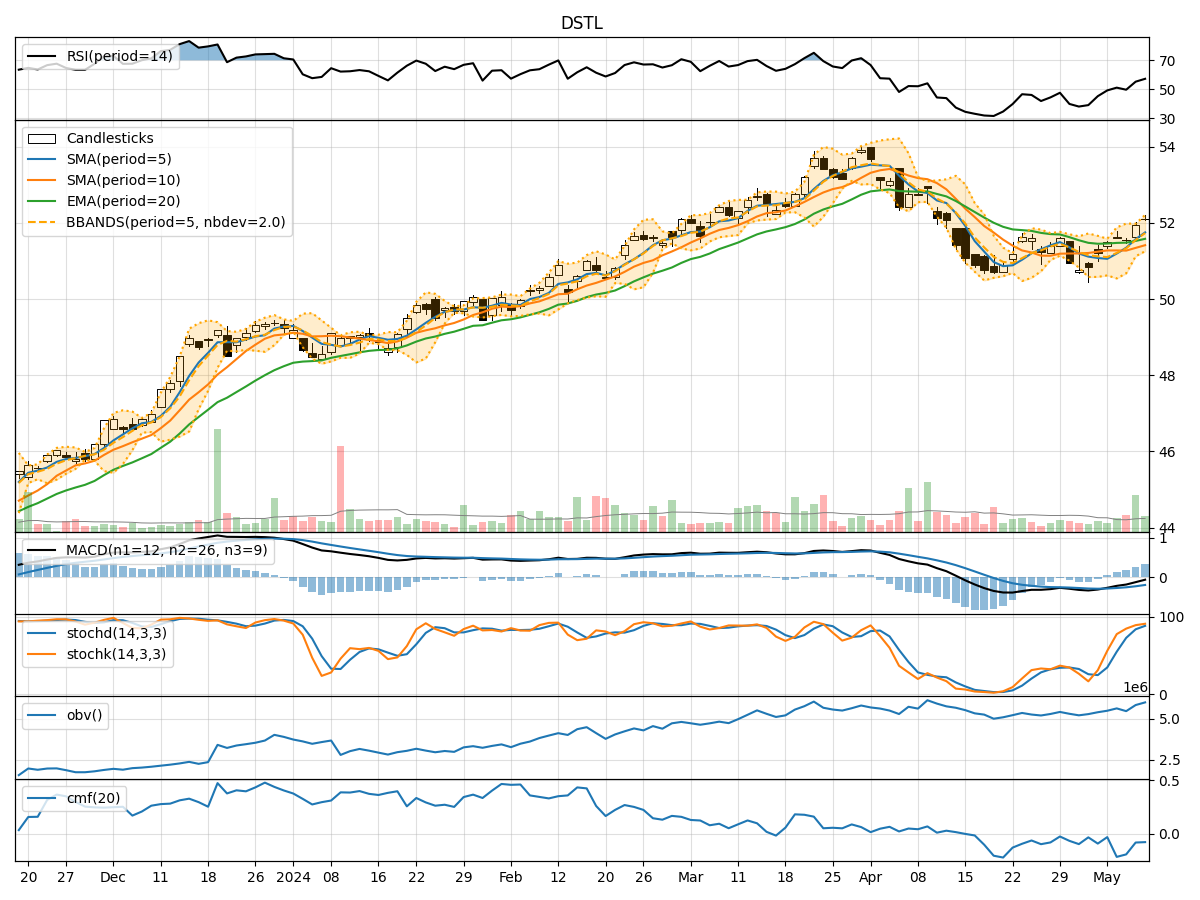
- Moving Averages (MA): The 5-day Moving Average (MA) has been consistently above the Simple Moving Average (SMA) and Exponential Moving Average (EMA), indicating a short-term uptrend.
- MACD: The MACD line has been negative but showing signs of convergence towards the signal line, suggesting a potential reversal in the trend.
- Conclusion: The trend is upward but with some potential reversal signals based on the MACD.
Momentum Analysis:
- RSI: The Relative Strength Index (RSI) has been fluctuating around the neutral level, indicating a balanced momentum.
- Stochastic Oscillator: Both %K and %D have been in the overbought zone, suggesting a strong bullish momentum.
- Conclusion: Momentum is neutral to bullish based on RSI and strongly bullish based on the Stochastic Oscillator.
Volatility Analysis:
- Bollinger Bands (BB): The stock price has been trading within the Bollinger Bands, with the bands narrowing, indicating decreasing volatility.
- Conclusion: Volatility is decreasing, which may lead to a period of consolidation or sideways movement.
Volume Analysis:
- On-Balance Volume (OBV): The OBV has been fluctuating, indicating indecision among investors.
- Chaikin Money Flow (CMF): The CMF has been negative, suggesting selling pressure.
- Conclusion: Volume indicators show mixed signals with a slight bearish bias.
Overall Conclusion:
Based on the analysis of trend, momentum, volatility, and volume indicators, the next few days' possible stock price movement for DSTL is likely to be sideways with a slight bearish bias. The trend is currently upward, but there are signs of potential reversal, while momentum is mixed with a bullish bias. Volatility is decreasing, indicating a possible period of consolidation. Volume indicators suggest selling pressure, contributing to the bearish bias in the short term.
Recommendation:
- Short-term Traders: Consider taking profits or implementing hedging strategies due to the potential reversal signals in the trend.
- Long-term Investors: Monitor the stock closely for a clearer trend direction before making significant investment decisions.
- Risk Management: Implement stop-loss orders to protect gains and manage downside risk in case of a more significant bearish movement.
In conclusion, while the overall outlook for DSTL suggests a sideways movement with a slight bearish bias, it is essential to monitor the stock closely for any changes in the technical indicators that may signal a shift in the price direction.